|
OUR TEAM
LAB 5 WRITE-UP
SYBR Green Dye
SYBR green; nucleic acis gel, is one of the most sensetive stains available for detecting double stranded DNA in agarose and polyacrylamide gels. because of its senseitivity, it is very useful for assays where the presence of contaminating RNA or ssDNA might obscure results. its easy to use as gels soaked in diluted stain can be visualized without desalting. it is detectable with UV lights, gel documentation systems and laser scanners.
Single-Drop Fluorimeter
fluorimeter is a fluroscence parameter messurment device. its intensity and wavelength distribution of emission spectrum after excitation by a certain spectrum of light. these parameters are used to identify . these parameter are used to identify the presence and the amount of a certain molucule in the medium. they can detect dlurocent molcule concetration up to 1 ppt ( part per trillion)
How the Fluorescence Technique Works
Fluorescence is a very sensitive detection technique. A beam of light shines through the drop at a certain wavelength and excites the electrons in molecules of the drop causing it to emit a light of a longer wavelength. The slide we are using is coated with a rough layer of Teflon but has circles of bare glass. This combination of properties results in a superhydrophobic surface that allows the solution to cling to the glass but repel from the layer of Teflon. The environment from the slide allows the blue LED light to focus on the drop and thus increases the intensity of the fluorescence event. The combination of the SYBR Green Dye I and the solution form a complex with the DNA that prefers to go to the surface creating the beach ball shaped drop on the slide. This specific material creates the perfect environment to then measure the fluorescence of the sample. In this particular experiment, we use ImageJ software to measure and analyze the degree at which the fluorescence is emitted from the sample to understand the components of the DNA sample.
Procedure
Smart Phone Camera Settings
- Type of Smartphone: iPhone 4s
- Flash: Off
- ISO setting: Auto
- White Balance: Auto
- Exposure: Auto
- Saturation: Auto
- Contrast: Auto
Calibration
- Turn the fluorimiter light on.
- Adjust the camera's settings to match the above.
- Place the phone on the cradle or stand at a right angle from the slide, perpendicular to the surface.
- Adjust the height of the fluorimeter using the plastic trays so that the camera picture has a clear view of the side of the drop.
Error creating thumbnail: File missingError creating thumbnail: File missing
The set up of the fluorimeter should look similar to shown(right image) and when looking through the phone's camera screen, it should appear similar to shown (left image).
- Distance between the smart phone cradle and drop = 8cm
Solutions Used for Calibration
| Concentration of Calf Thymus DNA (µg/mL) |
Volume of DNA Solution (µL) |
Volume of SYBR Green I Dye Solution (µL) |
Final Concentration of DNA in solution (µg/mL)
|
| 5 |
80 |
80 |
2.5
|
| 2 |
80 |
80 |
1
|
| 1 |
80 |
80 |
0.5
|
| 0.5 |
80 |
80 |
0.25
|
| 0.25 |
80 |
80 |
0.125
|
| 0 |
80 |
80 |
0
|
Placing Samples onto the Fluorimeter
1. Insert the slide into the fluorimiter with the smooth, glass side down.
2. Get a 80 microliter measurement of the SYBR Green I and place this drop in the middle of the first two rows of the slide. The drop should look like a ball on top of the slide.
3. Get a 80 microliter measurement of the calf thymus solutions and place this solution on top of the SYBR Green I.
4. Align the slide so that the blue LED light is focused by the drop to the middle of the black fiber optic fitting on the other side of the drop.
5. Set the camera timer, then put the light box over the whole setup.
Data Analysis
Representative Images of Samples
No DNA:
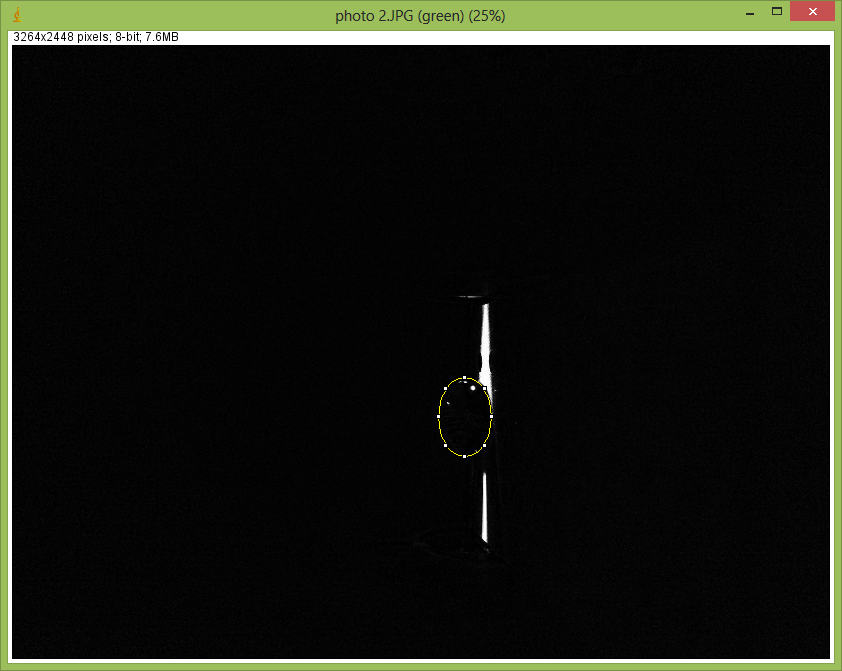
DNA:
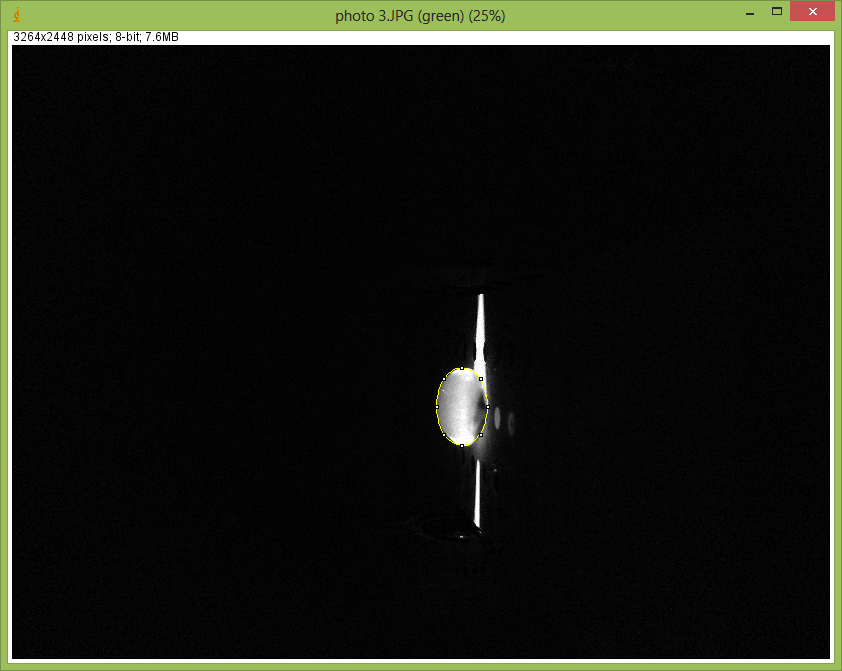
Image J Values for All Samples
| Final DNA concentration in SYBR Green I solution (µg/mL)
|
AREA
|
Mean Pixel Value
|
RAWINTDEN OF THE DROP
|
RAWINTDEN OF THE BACKGROUND
|
DROP-BACKGROUND
|
|
|
|
|
|
|
| 2.5 |
47600 |
175.604 |
8358740 |
192210 |
8166530
|
| 2.5 |
49624 |
173.63 |
8616223 |
209182 |
8407041
|
| 2.5 |
49624 |
176217 |
8744600 |
211479 |
8533121
|
| 1 |
49624 |
117.528 |
5832208 |
188774 |
5643434
|
| 1 |
49624 |
118.981 |
5904302 |
190959 |
5713343
|
| 1 |
49624 |
113.687 |
5641590 |
188851 |
5452739
|
| 0.5 |
49624 |
80.465 |
3992971 |
181507 |
3811464
|
| 0.5 |
49624 |
78.058 |
3873566 |
185690 |
3687876
|
| 0.5 |
49624 |
78.988 |
3919689 |
184420 |
3735269
|
| 0.25 |
49624 |
81.546 |
4046657 |
162423 |
3884234
|
| 0.25 |
49624 |
82.679 |
4102843 |
168964 |
3933879
|
| 0.25 |
49624 |
90.321 |
4482073 |
167377 |
4314696
|
| 0.125 |
49624 |
20.713 |
1027841 |
165444 |
862397
|
| 0.125 |
49624 |
21.425 |
1063195 |
163794 |
899401
|
| 0.125 |
49624 |
20.658 |
1025137 |
162862 |
862275
|
| 0 |
49624 |
7.155 |
355061 |
158941 |
196120
|
| 0 |
49624 |
6.243 |
309800 |
161363 |
148437
|
| 0 |
49624 |
6.479 |
321531 |
166295 |
155236
|
|
|
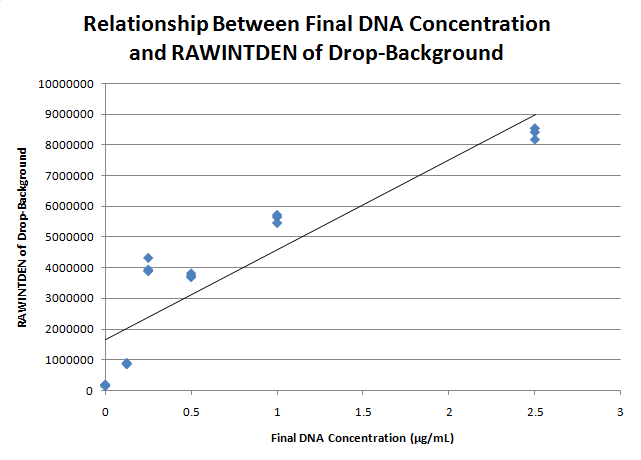
Fitting a Straight Line
PCR Results Summary
Instructor's summary: You completed 8 PCR reactions in a previous lab. You used the SYBR Green I staining and imaging technique to measure the amount of amplified DNA in each PCR reaction. You used a standard curve (based on known concentrations of calf thymus DNA) to convert INTDEN values into DNA concentration. Your positive control and negative control samples should be used as threshold values for determining whether an unknown (patient) sample is truly positive or negative.
Your positive control PCR result was ____ μg/mL
Your negative control PCR result was ____ μg/mL
Write-in each patient ID and give both a qualitative (what the images looked like) and a quantitative description (μg/mL) of what you observed
Patient 43849 :
Patient 80853 :
Compare each patient's results to the positive control value and the negative control value. Draw a final conclusion for each patient (positive or negative) and explain why you made that conclusion.
Patient 43849 :
Patient 80853 :
| 


