OUR TEAM
LAB 5 WRITE-UP
PCR Reaction Report
Due to the pre-lab materials, and some of our team member’s previous experience, our team was well informed before the lab of proper pipetting technique. To begin the lab we gathered our materials and properly labeled the sides of the PCR tubes for our group, following our template from part A of the lab. Our tubes were labeled as: G1 +, G1 -, G1 1-1, G1 1-2, G1 1-3, and G1 2-1, G1 2-2, G1 2-3, to show the different trials for each patient, along with our positive and negative controls. Before we began pipetting, we made sure our samples were fully thawed, in order to get correct measurements from the pipetting. Our pipetting was done in a group of two, for continuous quality check. We had some volume issues with our pipetting, and with the assistance of Dr. Haynes and some extra aster mix, these issues were corrected, giving us the proper volume of 50 µL in each PCR tube. After they were all properly pipetted, we programmed the PCR machine in accordance to the Lab Workbook. We then notified a TA, and they helped us load the tubes into the PCR machine, and have it properly programmed.
Fluorimeter Procedure
Smart Phone Camera Settings
- Type of Smartphone: iPhone (back-up), Samsung Galaxy Note 4 (used)
- Flash: off
- ISO setting: No setting, Set to 800
- White Balance:No setting, Auto
- Exposure: No setting, +2: highest setting
- Saturation: No setting, No setting
- Contrast: No setting, -2: lowest
Camera set-up
We placed the fluorimeter on top of two empty pipette tip trays, and then positioned the camera 8 cm away from the flourimeter, adjusted in place by folded paper, in order to keep the phone straight up so we can take a sideways picture. The camera timer was set at 5 seconds. We marked the location and remeasured the distance when we moved the camera between trials
- Distance between the smart phone cradle and drop = 8 cm
Placing Samples onto the Fluorimeter
- Attach a new pipette tip to the micropipetter, which is set at 80 μL
- Add 80 μL of SYBR Green I Solution in a single drop between the middle circles in the first two rows on the rough surface of a new slide
- With a new pipette tip, add 80 μL of either the sample or blank onto the previously present drop of SYBR Green I
- Align blue light in the fluorimeter with the center of the drop
- Place the fluorimeter under an upside down box that blocks out all other light
- Place the camera with the above-mentioned settings 8 cm in front of the fluorimeter
- Press the capture button, thus activating the timer, and close the flap
- Wait for the camera to capture the picture and repeat steps 6-8 for a total of 3 pictures
- Remove the slide and discard all material on it
- Repeat steps 1-9 for each sample needing testing (in this case, 6 times for calibration and 8 times for PCR reactions)
Data Collection and Analysis
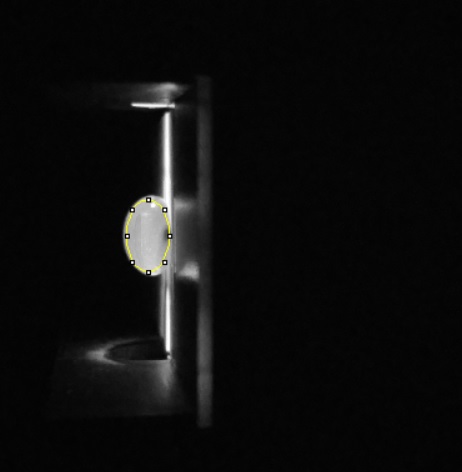
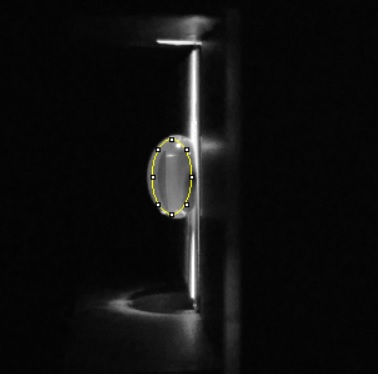
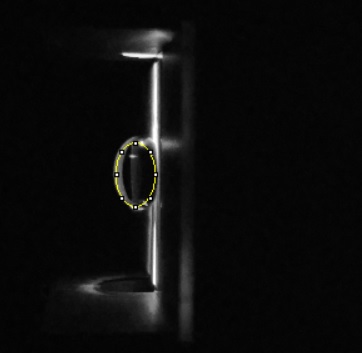
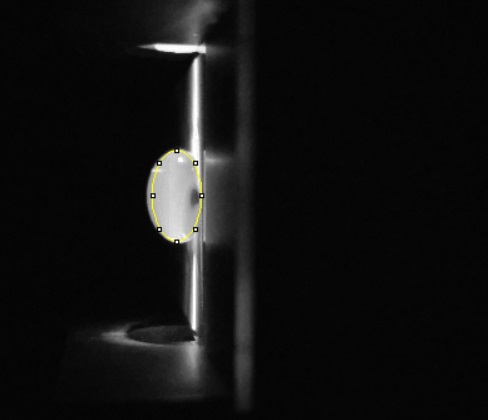
Images of High, Low, and Zero Calf Thymus DNA
High Concentration:
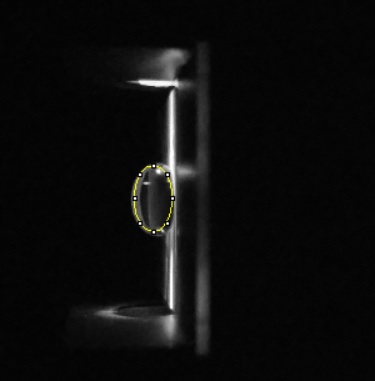
Low Concentration:
No Concentration:
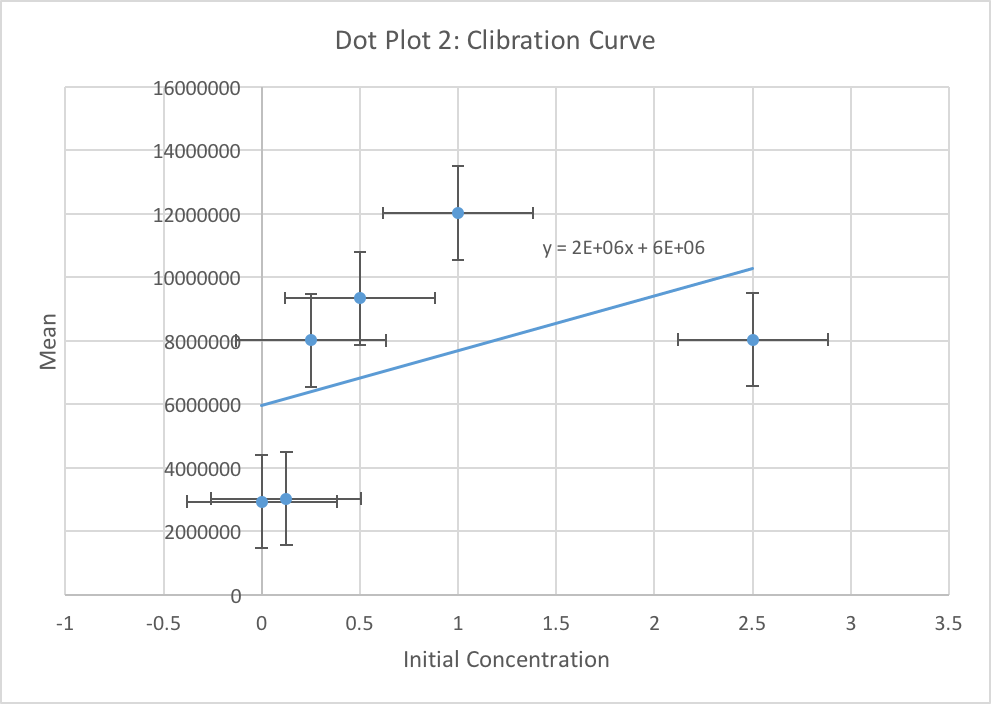
Calibrator Mean Values
| Initial Concentration of 2X Calf Thymus DNA solution (micrograms/mL)
|
Final DNA concentration in SYBR Green I solution (µg/mL)
|
Sample Number
|
RAWINTDEN DROP - BACKGROUND
|
'
|
'
|
MEAN
|
Standard Deviation
|
|
|
|
Image 1 |
Image 2 |
Image 3 |
|
|
| 5 |
2.5 |
C-1 |
11500687 |
11727326 |
870850 |
8032954.333 |
6203599.372
|
| 2 |
1 |
C-2 |
12763552 |
13260820 |
10054390 |
12026254 |
1725689.599
|
| 1 |
0.5 |
C-3 |
9120081 |
9101978 |
9790216 |
9337425 |
392232.9626
|
| 0.5 |
0.25 |
C-4 |
7612011 |
8115471 |
8292500 |
8006660.667 |
353052.5262
|
| 0.25 |
0.125 |
C-5 |
3082232 |
2782889 |
3201476 |
3022199 |
215654.2139
|
| 0 |
0 |
C-6 |
3401514 |
2545859 |
2851382 |
2932918.333 |
433615.6132
|
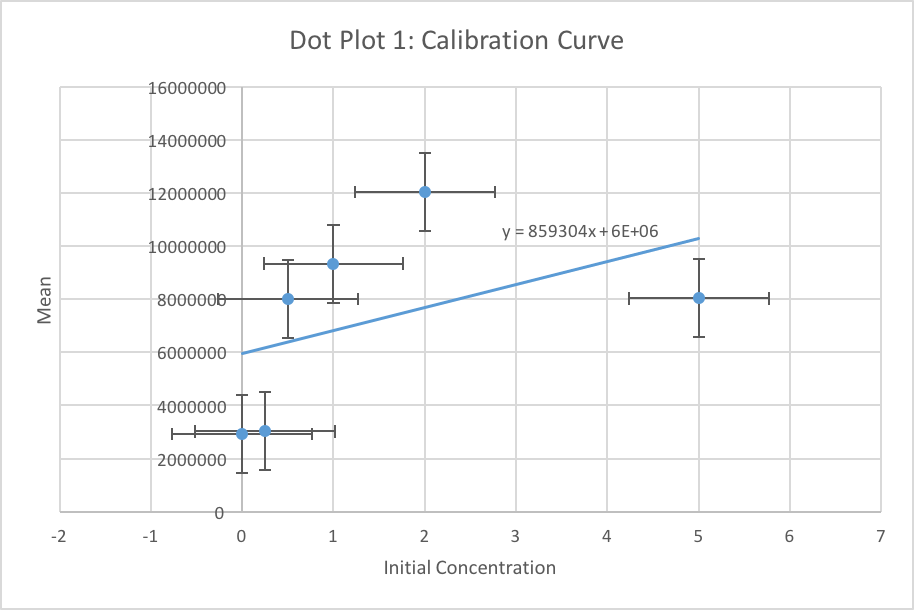
Calibration curves
Images of Our PCR Negative and Positive Controls
Positive Control:
Negative Control:
PCR Results: PCR concentrations solved
| PCR Product TUBE LABEL
|
RAWINTDEN DROP - BACKGROUND
|
'
|
'
|
MEAN
|
Standard Deviation
|
|
Image 1 |
Image 2 |
Image 3 |
|
|
| G1 + |
11197613 |
10004860 |
9616318 |
10272930.33 |
824026.5451
|
| G1 - |
2557014 |
2444811 |
2511807 |
10175677.33 |
56453.00416
|
| G1 1-1 |
3712743 |
4079116 |
4283647 |
4025168.667 |
289250.0309
|
| G1 1-2 |
2879984 |
3237511 |
3787064 |
3301519.667 |
456915.0508
|
| G1 1-3 |
3650829 |
3136043 |
3450691 |
3412521 |
259506.9712
|
| G1 2-1 |
13790299 |
15301484 |
16786776 |
15292853 |
1498257.145
|
| G1 2-2 |
9892540 |
10560817 |
9130519 |
9861292 |
715660.8277
|
| G1 2-3 |
11688632 |
12419617 |
11616580 |
11908276.33 |
444297.0073
|
PCR Results: Summary
- Our positive control PCR result was 2.136 μg/mL
- Our negative control PCR result was 2.087 μg/mL
Observed results
- Patient 30522 : For our first patient, the images from the fluorimeter gave us all images without the green glow,and after calculating the data, we determined that all of the patient's values were below 2.087
- Patient 46645 : Our second patient's pictures all appeared a vibrant green, and 2 of the 3 values given were about the positive control limit of 2.136
Conclusions
- Patient 30522 : All three of the patients trials were below the lower bound of 2.087, and the pictures did not have a green tone, we determined finally that our patient 30522 is negative.
- Patient 46645 : Our second patient had the majority of his values significantly over the higher bound of 2.136, and in our experiments with the fluorimeter, all of the images appeared to have the green glow. Therefore, with the information, we determined that our patient 46645 is positive.
|


