20.109(S07): cDNA synthesis and microarray
Introduction
Today you will use one tool, a DNA microarray, to simultaneously examine the expression of many genes. DNA microarrays are slides with DNA sequences spotted in a known order on the surface. The spots of DNA, each one smaller than the period at the end of this sentence, are placed on the slide surface with robotic arms or built one base at a time with photolithography. Each spot of DNA gets a unique address on the slide surface, and the identity and location of each spot get stored in the computerized “design file” for the array. The slide shown below is the same size as the one you’ll use (1 x 3 inches) but yours will have 11,000 spots of DNA arrayed instead of the 250 shown!

Two spots on the illustrated array are highlighted. The first spot, in Row 6 Position 30, is a 60-nucleotide sequence from the human gene for glyceraldehyde-3-phosphate dehydrogenase (GAPD). This gene, which encodes an essential metabolic enzyme, has been called a “housekeeping” gene since it must be expressed in all cells no matter how specialized. Other housekeeping genes include those for ACTB (encoding a cytoskeletal protein), TBP (encoding a general transcription factor), HPRT (encoding an enzyme required for nucleotide transport and metabolism), and PPIA (encoding an enzyme important for protein folding). The second spot highlighted on the array, in Row 4 Position 10, is a 60-nucleotide sequence from the human TERT gene. This gene encodes the protein subunit of telomerase, an enzyme that adds telomere repeats (TTGGGGTTG) to the end of chromosomes. As healthy cells age and divide, telomere repeats are lost. Cancerous cells express telomerase and so the telomeres do not shorten. Consequently, these cells “lose track” of how old they are and become immortal.
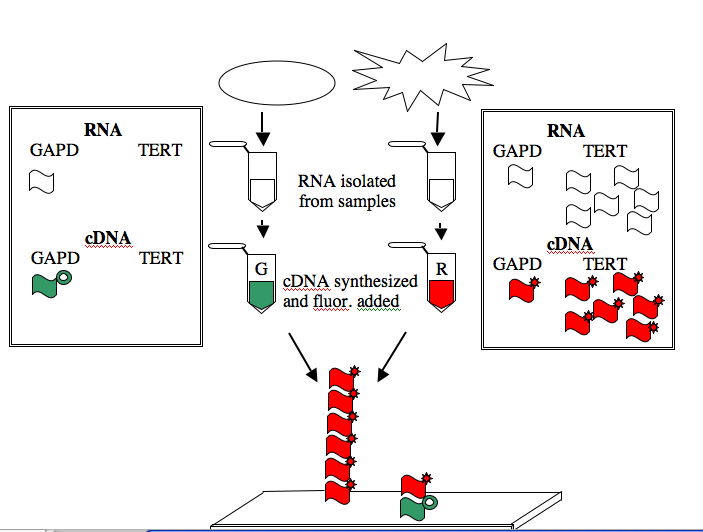
The GAPD and TERT spots can be used to illustrate how microarray data is generated and interpreted. Consider a group of “normal” cells and a cancerous version of them. RNA from each type of cell can be isolated (you’ve seen how quick and easy it is to isolate RNA), converted from RNA into a complementary strand of DNA (called cDNA), and then “color coded.” The most commonly used molecules for color-coding are the green-fluorescing cyanine 3 (Cy3) and the red-fluorescing cyanine 5 (Cy5).
For this example, the normal cells get green and the cancerous cells get red. The two colored samples are mixed and then simultaneously hybridized to a DNA microarray. The DNA spotted on the surface of the slide is in vast excess to either colored cDNA sample and so the intensity of each color will vary with the amount of RNA originally present in each sample. A gene expressed similarly in normal and cancerous cells, like the housekeeping GAPD gene, will give rise to a yellow spot in Row 6 Position 30 since equal amounts of green and red cDNA will be bound there and the merged color will appear yellow. By contrast, only red cDNA will bind at Row 4 Position 10 since cancerous cells express telomerase and normal cells do not.

NOTE: The cDNAs are not really piled on top of one another on the array. Rather they are hybridized side by side to the spot of DNA that is on the surface of the slide.
With an expensive machine, the slide is “scanned” to measure the intensity of the red and green light at each spot (remember we’re talking about 22,000 spots!) and the data can then be assessed and normalized. Corrections are often made to account for differences between Cy3 and Cy5 incorporation into the cDNA as well as how much of each fluorescent molecule sticks non-specifically to different areas of the slide. These are things you will do next time with your own data.
Protocols
Today you will convert the RNA isolated from your transfected cells into cDNA and hybridize the cDNA to a DNA microarray.
Part 1: cDNA synthesis
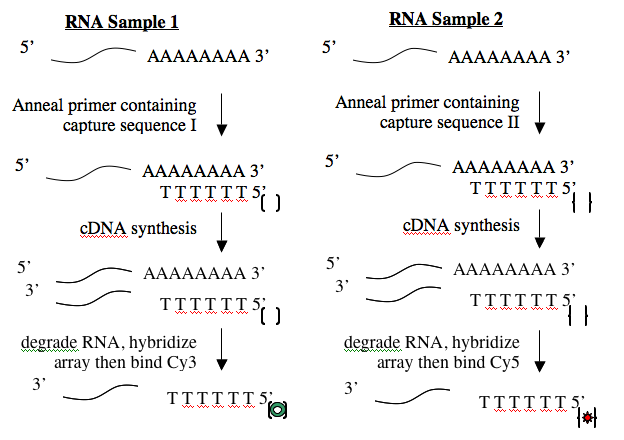
Creating cDNA from RNA is done using an enzyme called reverse transcriptase. Like all DNA polymerases, this enzyme can only add sequence to an existing chain and so needs a short “primer” to begin synthesis. To perform the cDNA synthesis, you will use a kit from a company named Genisphere. The primers in this kit have a special “capture sequence” at their 5’ end. The capture sequences allow the cDNA to be reacted with Cy3 or Cy5 later.

Before you begin today’s protocol, prepare your bench for working with RNA. This involves cleaning your pipetmen, retrieving your “RNA only” pipet tips and solutions and wiping down your bench. You should work on a fresh piece of benchpaper and remember to wear gloves when working with RNA.
- Calculate the volume needed for 3.5 ug of each RNA sample, then assemble the annealing reactions in RNase-free eppendorf tubes according to the following table.
| TUBE A | TUBE B | |
|---|---|---|
| RNA | 3.5 ug of RNA from parental strain | 3.5 ug of RNA from deletion strain |
| RNase-free H20 | bring volume to 10 ul | bring volume to 10 ul |
| RT primer | 1 ul Capture Sequence I vial 11, red |
1 ul Capture Sequence II vial 11, blue |
Part 2: practice array data analysis
Part 3: hybridize microarrays
DONE!
For next time
Reagents list
must wash and reprobe with dendrimers between this lab and next
