20.109(S15):DNA repair assays (Day5)
Introduction
The flow cytometry machine has revolutionized biology by allowing researchers to analyze and isolate cells based on their spectral qualities. Both genetic reporters and physical tags may be used to introduce fluorescence into cells. For example, if you have a fluorescently tagged antibody that preferentially binds to a unique cell receptor – or more likely, a set of antibodies that taken together identify a unique cell type – you can isolate a pure sample of this cell type from a complex mixture by using FACS: Fluorescence Activated Cell Sorting. Physical tags that are less specific than antibodies, such as ToPro3, are also used in flow cytometry. ToPro3 is a DNA stain that cannot pass through viable membranes and thus identifies dead cells. In addition to purification, the flow cytometer can count the number of cells that have a certain spectral quality. Technically, if the machine is used just for counting and not for separating subpopulations of cells, then the procedure is called flow cytometry, while cell sorting or isolation is called FACS. However, because FACS is shorter to say than flow cytometry, many people call anything to do with a flow cytometer FACS.
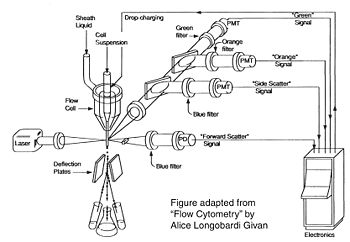
Before there were flow cytometers, there were Coulter counters. Coulter counters are automated cell counting machines developed in the 1950s that count cells as they flow in a liquid stream. In an ingenious conceptual leap, Mack Fulwyler combined the technology of ink jet printers with that of Coulter counters to develop the first flow cytometer. The ink jet printer head works by vibrating a nozzle so that a spray of discrete droplets is formed. Similarly, in a flow cytometer, a liquid suspension of cells is forced at high pressure through a vibrating nozzle to create tiny charged droplets, each containing a single cell. The stream of droplets passes in front of a laser beam, and the scattered light is analyzed by a series of filters and photomultiplier tubes that convert the light signal into electrical impulses. Thus, each cell is "interrogated." In FACS, the spectral qualities of the cell are analyzed nearly instantaneously and compared to user-specified spectral qualities. For example, if you have a mixture of green fluorescent cells and non-fluorescent cells, you can ask the machine to isolate the green cells. If a cell registers as green, an electrical charge deflects the cell to make it fall into a collection chamber. In FC, each cells is interrogated, and documented as fluorescent or not, but then all the cells go into the same waste stream.


Cell sorting, or FACS, is technically challenging and most FACS machines are only run by experts. In contrast, regular old biologists and biological engineers are often trained to perform flow cytometry as graduate students. In preparation for an FC experiment, the user must appropriately set voltage, compensation, and gating using control samples; failure to set these parameters correctly will result in GIGO (garbage in, garbage out). The next step of an FC is experiment is to measure the experimental samples on the machine. The final step is to document and analyze the statistics output by the flow cytometer. In our case, this last step involves making an additional set of analysis gates. Although these three steps will primarily be done by the teaching faculty, we will describe them briefly below.
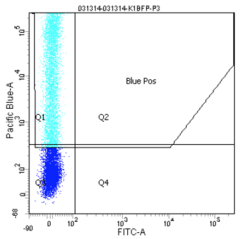
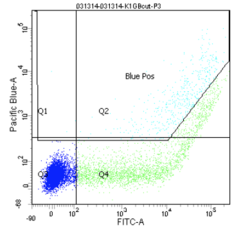
How does the machine "know" which cells are fluorescent or not? There is no magic here; the user must tell it. The first key control to include is a mock/negative control: the cells undergo the lipofection treatment, but without any DNA. The reason to mock transfect these cells is in case their viability or FC profile is affected by the lipofectamine itself. We view these cells first under side scatter versus forward scatter. Forward scatter (FSC) is proportional to size, while side scatter (SSC) tells us something about shape/roughness of the cell. The cells should be the largest objects in the solution, while dust and cell debris will tend to fall at very low FSC. Note that in the gate labeled "P1" below we do exclude very high FSC and very high SSC events, as these are likely aggregates of cells and dead cells, respectively. The voltages should be set such that few or no cells are lost on the SSC axis. Raising the voltage shifts cells up or right, while lowering the voltage shifts the cells down or left. Next we look at blue fluorescence (Pacific Blue) versus green fluorescence (FITC). We set the voltage to keep these negative cells in the lower left corner, while still keeping all of the cells visible, and set the gating such that 0-0.1% of negative cells show up as fluorescent.


We then perform similar adjustments using single-color controls: cells that have been transfected only with GFP or only with BFP. The BFP spectrum is quite nicely contained, and doesn't "bleed into" the GFP spectrum at all. In other words, blue fluorescent cells won't also (spuriously) appear green. In contrast, the GFP spectrum does bleed into the BFP spectrum. Normally, we could use mathematical compensation to fix this issue: simply subtract a fixed percentage of the GFP fluorescence signal from the BFP signal! However, lipofection in particular leads to a small population of highly fluorescent cells that are not well-adjusted by compensation, and instead must be gated out.


Finally, the experimental samples, which are co-transfected with GFP and either intact or damaged BFP, may be observed, and will look similar to the plots below. By measuring the percentage of cells that fluoresce blue, and normalizing according to the equation presented on Day 5, you will have some measure of the frequency of non-homologous end-joining within CHO cells.


Flow cytometers have been around since the 1970s, and while the details have gotten fancier (more colors, faster measurements, etc.), the general principles have remained the same. It is truly a testament to the versatility and utility of flow cytometry that the technology does not look to be supplanted by another approach any time soon.
After preparing your samples to be measured by flow cytometry, you will prepare one final validation experiment: a dose response curve for the C401 DNA-PK inhibitor. Six flasks of cells have been pre-treated with different amounts of C401. Working together as a class, you will count the cell abundance in each trypsinized flask, while a member of Samson lab takes the remaining cells away and irradiates them. On his/her return, you will follow Part 2 of the protocol below. We will discuss the background of this experiment further in the Day 7 introduction and pre-lab.
Protocols
Part 1: Prepare cells for flow cytometry
- Begin by briefly looking at your cells under the microscope. Do the cells in any wells appear less dense or less healthy than in others? Note down any such observations.
- Aspirate the media from each well according to the protocol below.
- As you work, tip the plate down a little to pool the media at the bottom of each well.
- Place your aspirator at the bottom of a well, and suck up the media. Remove all the liquid, but remove the aspirator promptly after that or you may damage/aspirate some cells.
- Before moving to the next (non-duplicate) well, dip your aspirator briefly (less than a second!) in ethanol. Then hold the Pasteur pipet up to dry and count to 3.
- Alternatively, you may use a fresh yellow tip on the end of the Pasteur pipet when changing samples.
- Gently distribute 0.5 mL of warm PBS to each well, using a 2 mL serological pipet.
- In other words, don't blast the liquid right at your cells.
- Repeat the aspiration step, again using the ethanol to clear the pipet between samples.
- Add 0.25 mL of phenol-red-free trypsin/EDTA to each well, using a P1000.
- Incubate for about 3 min, until cells are rounding up and starting to come off.
- Meanwhile, label your flow cytometry tubes according to the tables below.
- Distribute 0.25 mL of media to each well. You are welcome to use the same pipet tip for each well, as long as you don't touch the tip down into the trypsin/well!
- One well at a time, follow the protocol below to transfer a uniform cell suspension to the appropriately labeled flow cytometry tube.
- Pipet the full 0.5 mL of solution up and down about four times. Make sure to vary where your tip is in the well, concentrating on the four "edges" of the circle (if the circle were, you know, a square) to more fully resuspend the sticky cells. Check the first well or two under the microscope to be confident of your technique. You should see very few cells.
- On the final resuspension, have your partner hand you the filter-topped flow cytometry tube. Press the blue tip gently against the top of the filter, and expel the cells. You should see the liquid go right through; if you feel resistance, ask for help.
- Each tube should be immediately returned to your ice bucket.
Sample order for each team: K1 intact, K1 intact duplicate, Drug intact, Drug intact duplicate, xrs6 intact, xrs6 intact duplicate, K1 damaged, K1 damaged duplicate, Drug damaged, Drug damaged duplicate, xrs6 damaged, xrs6 damaged duplicate.
The original table has been revised to correspond with your file numbers! (A few teaching faculty samples will be evaluated first.)
| Team Color | Tube numbers assigned T/R | Tube numbers assigned W/F |
|---|---|---|
| Red | 10-21 | |
| Orange | 28-39 | 22-33 |
| Yellow | 40-51 | 34-45 |
| Green | 52-63 | 46-57 |
| Blue | 64-75 | 58-69 |
| Pink | 70-81 | |
| Purple | 76-87 | 82-93 |
| Platinum | 94-105 |
Part 2: Treat cells for inhibitor dose response
Today you will validate the function of your NHEJ inhibitor. This will serve as the final 'system validation' experiment for Module 2. Last night we plated 250 cells per well in a 6-well plate -- you read that correctly, only 250 cells! The goal of this experiment is to determine how many single cells survive the 4 Gy of irradiation that they will be exposed to after drug treatment. Remember, NHEJ is key to repairing double strand DNA breaks due to radiation, so if the NHEJ pathway is inhibited the cells will be unable to repair their DNA and have a higher liklihood of dying. Five of the wells were plated with CHO-K1 cells and one well was plated with xrs6 cells for comparison.
You will treat these cells with increasing doses of your inhibitor of choice. How did we pick what concentrations of inhibitor to use? The datasheet for each inhibitor reported an IC50, the concentration of inhibitor that causes 50% inhibition of a response. For DMNB and NU-7441 the IC50 suggests the concentration where 50% of the activity of DNA-PKcs is lost. For Mibefradil and Loperamide the IC50 values were reported in the Goglia et al. paper.

| Drug | Reported IC50 | Stock concentration | Concentrations to prepare |
|---|---|---|---|
| Mibefradil | 4.1 uM | 20 mM | 0, 2.5, 5, 10, 20 uM |
| Loperamide | 2.8 uM | 12 mM | 0, 1.5, 3, 6, 12 uM |
| NU-7441 | 1 uM | 14 nM | 0, 10, 20, 50, 100 nM |
| DMNB | 24 mM | 15 uM | 0, 7.5, 15, 30, 60 uM |
- For each well you need to prepare 3 mL of media + drug.
- Mibefradil, Loperamide, and NU-7441 are soluble in water, therefore 'vehicle' = cell media for those drugs
- DMNB is soluble in DMSO at X mM, therefore 'vehicle' = DMSO + media.
- Make a plan for preparing each concentration of your drug. Do not try to pipette less than 2 uL into a large volume -- instead make intermediate dilutions.
- Note for those using DMNB: You must use the same amount of DMSO in each well. Make a plan for how to accomplish this. We have extra DMSO available for you.
- Once you have your drugs ready, remove a 6-well plate from the incubator and replace the media. Be sure to label the top of the wells with your drug and concentration (and team name/day!!).
- Return the plates to the incubator. At 6pm we will irradiate the plates with 4 Gy using the irradiator in building 76 (Koch Institute). Thanks to Marcus Parish, a graduate student in Bevin Engelward's lab for helping with this step!
- On Saturday (T/R section) or Sunday (W/F section) we will replace the media with fresh (drug-free) cell culture media.
- Next week you will fix the cells and stain the colonies that remain on the plate. Because of the very low cell seeding density that was used, each colony represents one cell (kind of like bacteria culture!) and you will use the colony count as an indication of inhibitor efficacy.
Homework
Due in class on M2D6
Read this paper and follow these questions for guidance.
Due on M2D7, but you may want to start sooner…
Schematic diagram Results outline -- including one flow cytometry figure + results
Reagent list
- 0.5% Trypsin/4.8 mM EDTA diluted 2-fold in PBS (Life Technologies)
- OptiMEM as on Day 5
- Compound 401 at designated concentrations (Tocris/R&D Systems)
- prepared from 5 mM stock solution in ethanol
- Media and trypsinization reagents as on M2D1
- BD LSR II flow cytometer (BD Biosciences)
- Green excitation: 488 nm
- Blue excitation: 405 nm
- Green emission filter: FITC -- 530 nm emission peak, 30 nm width
- Blue emission filter: Pacific Blue -- 450 nm emission peak, 50 nm width
- Cells for irradiation experiment
- were plated at 400,000 2 days in advance (T/R) or 200,000 3 days in advance (W/F) in T25s
- the day before use, C401/ethanol mixtures (with ethanol volume kept constant) were added to the cells at 5 pm
Next Day: Data analysis and paper discussion
Previous Day: Cell preparation for DNA repair system
