2020(S11) Lecture:week 7: Difference between revisions
No edit summary |
No edit summary |
||
| Line 32: | Line 32: | ||
|} | |} | ||
=<center>Week 7 Studio</center>= | =<center>Week 7 Studio</center>= | ||
==<font color = blue> ''' | Are there tools or methods for breaking down a complicated problem into simpler parts? | ||
*Watch the [http://www.biobuilder.org/animations/ Abstraction animation] from BioBuilder | |||
*Walk through one sample abstraction hierarchy that may guide synthetic biology<br> | |||
This abstraction hierarchy is modified from one of [[Drew Endy | Drew Endy's]] slides. It gives us a framework for how to intentionally engineer various aspects of biological systems. | |||
<br style="clear:both" /><center>[[Image:Hierarchy def.png]] | |||
[[Image:Abstraction redrawn.png]]</center> | |||
==<font color = blue> Abstraction in action: Systems to Devices</font color>== | |||
<center>'''Three quick examples to put the abstraction hierarchy in action'''</center> | |||
===First up: Arsenic detector=== | |||
[[Image:Arsen Dev-level.png|450px|left]]Recall the University of Edinburgh 2006 iGEM project that was described as an Arsenic Detector in the "abstraction" BioBuilder video. The system was designed to sense arsenic and result in a color. Two devices were used to build this system. The first device sensed arsenic and gave rise to a signal when arsenic was detected. And if the second device sensed the signal from the first device, then it gave rise to a color. The device-level system diagram is pretty straightforward, but makes clear that you could swap out the first device for a different sensor, as long as the output could still be interpreted by the second device. Similarly you could change the output from color to anything, as long as the input to that color-generating device was paired to the output of the arsenic sensor. <br style="clear:both" /> | |||
===Next: Bacterial buoy=== | |||
Consider again the coliform project from the Melbourne 2007 iGEM team. The team listed six devices they needed to realize their idea: | |||
# a red light sensor | |||
# a blue light sensor | |||
# an AND gate to trigger a cellular behavior when both lights are present | |||
# a GFP reporter to monitor easily/quantifiably the AND gate's function | |||
# expression of adhesive proteins under the control of the AND gate | |||
# a gas vesicle expression cassette to produce naturally buoyant bacteria | |||
Working with your project team at the white boards, draw a device-level system diagram for the six devices listed here. These devices should be "wired" together in a meaningful way so the inputs and outputs can be understood as entry and exit wires. After '''just 5 minutes''' we'll see the device level system diagrams that you've drawn for this system and discuss any outstanding questions or concerns. | |||
===And finally: Polkadorks=== | |||
Let's try a more dynamic system. The 2004 IAP team wanted their engineered cells to "form, diffuse, and form again in random areas on the plate. Our system should thus form time-varying patterns based on local random time-varying symmetry breaking." Check out the Polkadorks [http://parts.mit.edu/wiki/index.php/Image:Intro1-EcolibratorMovie.gif animation]. | |||
*'''As a class''' we'll | |||
**describe the system in plain language, then | |||
**list the devices needed to implement the system | |||
*Then '''as a team''' you'll have '''10 minutes''' to draw a device-level system diagram. | |||
*Finally, '''as a class''', we'll look at the timing diagram that the 2004 IAP team wrote. | |||
<center>[[Image:Ecolibrator TimingDiagram.png|center|650pxl| timing diagram for the Polkadork's Ecolibrator project]]</center>You'll see that the devices (or the named connections between these devices) are listed on a y-axis and time is shown on an x-axis. The timing diagram indicates the '''timing for operation''' of each device or wire, including the persistence of each device's signal through time--shown as PS (protein synthesis) and PD (protein degradation). '''You and your team''' should take 10 minutes to make a timing diagram for the Polkadork's devices that you have wired together. You can keep a running list of any uncertainties. '''After 10 minutes of work,''' we'll have each team report back to the group to see how we did and what questions still remain. | |||
==Get busy!== | |||
Start applying these ideas to your team's project. You can work on a device list, a device-level system diagram and a timing diagram if you're ready. | |||
=<center>Week 7 Thursday</center>= | =<center>Week 7 Thursday</center>= | ||
==<font color = blue> </font color>== | ==<font color = blue> </font color>== | ||
==<font color = blue>Why are we doing this?</font color>== | ==<font color = blue>Why are we doing this?</font color>== | ||
Revision as of 09:52, 8 March 2011
Week 7 Tuesday
Getting Technical
Over the next few weeks we will spend nearly all of our lecture and studio time specifying these aspects of your project:
- a high level system specification (i.e. a plain language overview of what your project will do)
- a pseudo-code description of your system (i.e. a series of IF, THEN statements that program your cell)
- a block diagram showing the system's architecture (i.e. a simple series of squares inside a cell to show functions and their connections)
- a device/modules list
- a timing diagram
- a parts list
Be ready to revise what seemed like completed aspects of your project as you learn more about what's available and how things work. Design/revise/design/revise/design/revise....that's what the next few weeks will be all about...
Project Selection Status?
- Brief report of each team's project selection status.
System Overview: Bacterial Buoy
- You and your project team will describe the highlevel a system behavior for an engineered system, namely for the Melbourne 2007 iGEM "coliform" project.
- The Melbourne team wanted to build a 3D, floating mass of bacteria that adhered to one another when the cells detected both blue and red light. In other words: at the intersection of an incoming red light beam and blue light beam, a solution of bacteria would clump and remain suspended in its growth media.

- As a class we'll watch the first 5 minutes of the Melbourne team's iGEM presentation.
- Next your project team should work out a high level overview of the system's behavior for the coliform project and some pseudo-code to program this behavior. Finally write on the white board a block diagram that connects the inputs and outputs for the cell. You should not spend more than 10 minutes on this activity. When you are done, delegate someone to explain what you've done as a team and what questions arose as you worked. Then you and your team can get right to work on the last thing planned for today's lecture.
System Overview: Your Idea Here
Finally, take the rest of today's lecture time to illustrate or specify the system overview of your team's project in plain language, in psuedocode, and in a block diagram. Some version of the system overview you generate today will be included in your Tech Spec Review.
|
If there are outstanding issues related to the system overview for your project be sure everyone on your team knows how you'll try to solve the issue(s). Make a plan to come to studio tomorrow with materials for finishing the system overview and getting good work done on the device list and, perhaps the timing diagram. |
Week 7 Studio
Are there tools or methods for breaking down a complicated problem into simpler parts?
- Watch the Abstraction animation from BioBuilder
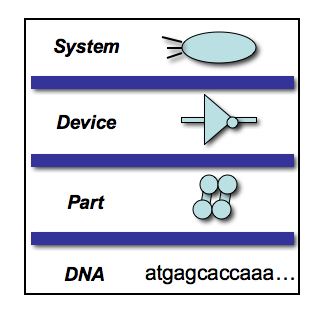
- Walk through one sample abstraction hierarchy that may guide synthetic biology
This abstraction hierarchy is modified from one of Drew Endy's slides. It gives us a framework for how to intentionally engineer various aspects of biological systems.


Abstraction in action: Systems to Devices
First up: Arsenic detector

Next: Bacterial buoy
Consider again the coliform project from the Melbourne 2007 iGEM team. The team listed six devices they needed to realize their idea:
- a red light sensor
- a blue light sensor
- an AND gate to trigger a cellular behavior when both lights are present
- a GFP reporter to monitor easily/quantifiably the AND gate's function
- expression of adhesive proteins under the control of the AND gate
- a gas vesicle expression cassette to produce naturally buoyant bacteria
Working with your project team at the white boards, draw a device-level system diagram for the six devices listed here. These devices should be "wired" together in a meaningful way so the inputs and outputs can be understood as entry and exit wires. After just 5 minutes we'll see the device level system diagrams that you've drawn for this system and discuss any outstanding questions or concerns.
And finally: Polkadorks
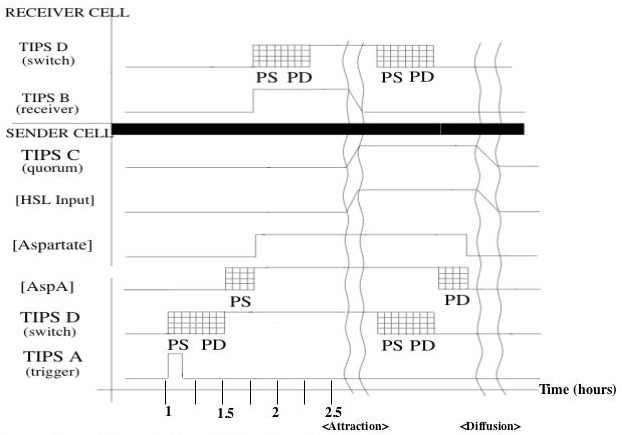
Let's try a more dynamic system. The 2004 IAP team wanted their engineered cells to "form, diffuse, and form again in random areas on the plate. Our system should thus form time-varying patterns based on local random time-varying symmetry breaking." Check out the Polkadorks animation.
- As a class we'll
- describe the system in plain language, then
- list the devices needed to implement the system
- Then as a team you'll have 10 minutes to draw a device-level system diagram.
- Finally, as a class, we'll look at the timing diagram that the 2004 IAP team wrote.

Get busy!
Start applying these ideas to your team's project. You can work on a device list, a device-level system diagram and a timing diagram if you're ready.
