BME100 f2013:W900 Group17 L3: Difference between revisions
| Line 38: | Line 38: | ||
==Results== | ==Results== | ||
[[Image:G2Inside.jpg]] | [[Image:G2Inside.jpg]] | ||
[[Image:G2Outside.jpg]] | [[Image:G2Outside.jpg]] | ||
Revision as of 10:50, 25 September 2013
| Home People Lab Write-Up 1 | Lab Write-Up 2 | Lab Write-Up 3 Lab Write-Up 4 | Lab Write-Up 5 | Lab Write-Up 6 Course Logistics For Instructors Photos Wiki Editing Help | |||||
|
OUR TEAM
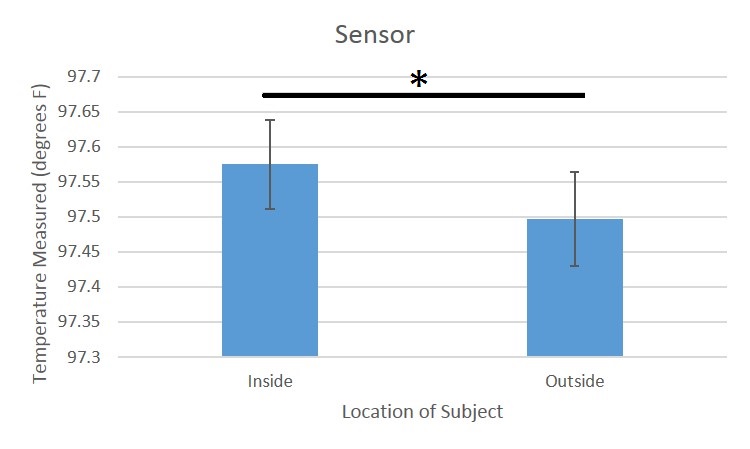
LAB 3A WRITE-UPDescriptive StatisticsIn order to describe this data set, statistical values were taken from both the data set of values collected inside and the data set collected outside as well as the entire data set of the product test. In total, temperature readings from the inside and outside were taken by 15 groups for a total of 15 trials. For the subset of temperature readings taken with the thermometer within the inside data set the average reading was 97.57533333 degrees accross with a standard deviation of 0.778049244 and a standard error of 0.063527455. Then for the subset of temperature readings taken with the RAIIN sensor within the inside data set the average reading was 94.48466667 degrees with a standard deviation of 2.064618419 and a standard error of 0.168575388. Taking a T test comparing the thermometer readings set of results with the RAIIN sensor set of results the result was 1.22112E-39 which signifies that there is a high level of confidence in a difference existing within the two data sets. Furthermore, upon taking the Pearson's r correlation test it was found that there is only a positive correlation level of 0.165252944 between the temperature readings data set and the RAIIN sensor data set within the context of the larger inside data set. This is not a high correlation and so it is safe to conclude that the two data sets are significantly different.
Now taking the outside data set and inside data set togetherer with the new set separation being solely the set of readings taken with the thermometer and the set of readings taken with the RAIIN sensor, a t-test result was found, 4.18844E-72, which again indicates that there is a significant difference between the readings taken with the thermometer and those taken with the RAIIN sensor. And with a correlation of only 0.167395055 found between these two sets, it is safe to further strengthen the conclusion that the readings taken with the two devices are not similar.
ResultsAnalysis(Perform inferential statistics described in assignment.)
Summary/DiscussionErrors: May lose signal; connects to other devices on bluetooth; indecipherable, ambiguous instructions; different name for bluetooth
LAB 3B WRITE-UPTarget Population and NeedAthletes Parents with young children so that they could monitor the body temperature of their kids
Device DesignSmaller, variety of colors, one color
Inferential Statistics
Graph
| |||||


