BME100 f2017:Group5 W1030 L3: Difference between revisions
Thomas J. On (talk | contribs) |
Thomas J. On (talk | contribs) |
||
| Line 32: | Line 32: | ||
==Descriptive | ==Descriptive Statistics and Graphs== | ||
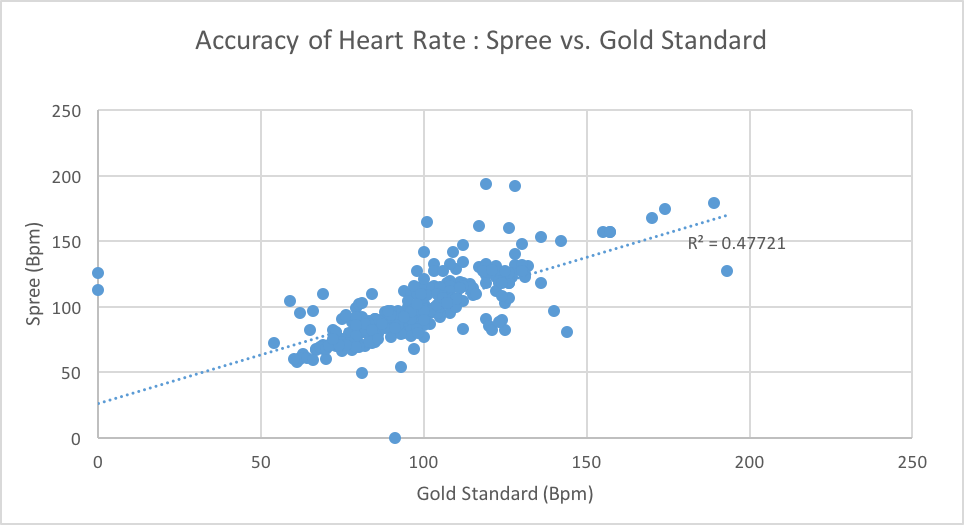
HEART RATE <br> | HEART RATE <br> | ||
Revision as of 16:10, 20 September 2017
| Home People Lab Write-Up 1 | Lab Write-Up 2 | Lab Write-Up 3 Lab Write-Up 4 | Lab Write-Up 5 | Lab Write-Up 6 Course Logistics For Instructors Photos Wiki Editing Help | ||||||
|
OUR TEAMLAB 3 WRITE-UPDescriptive Statistics and GraphsHEART RATE  http://www.openwetware.org/images/b/bd/SCATTER_HEART.png TEMPERATURE
Inferential StatisticsA t-test was performed for each biometric category because within Heart Rate and Temperature, respectively, there were two data sets being compared: the Gold Standard and the Spree.
Since t-tests are used for 2 data sets, the t-test was used as opposed to the ANOVA, which is for more than 2 data sets.
The t-tests were both 2 tailed (because we did not predict which data set would be bigger/smaller/etc) and paired (because the same people were used for both data sets in each Temperature and Pulse test)
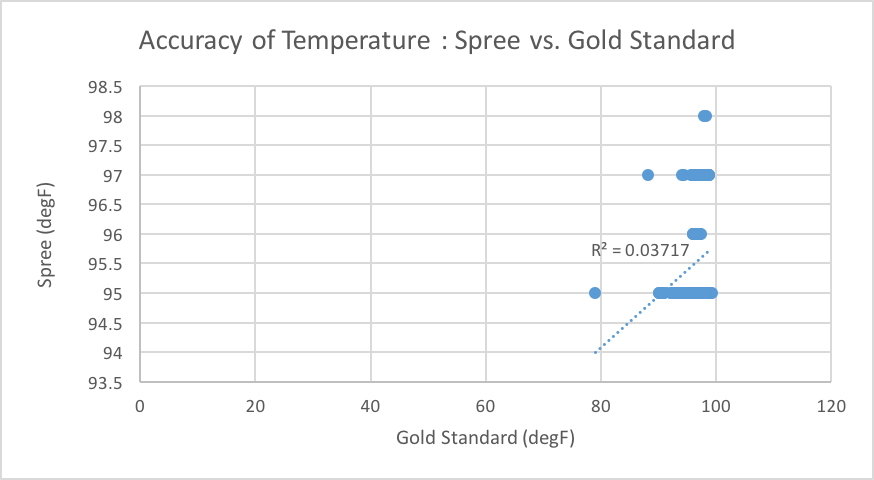
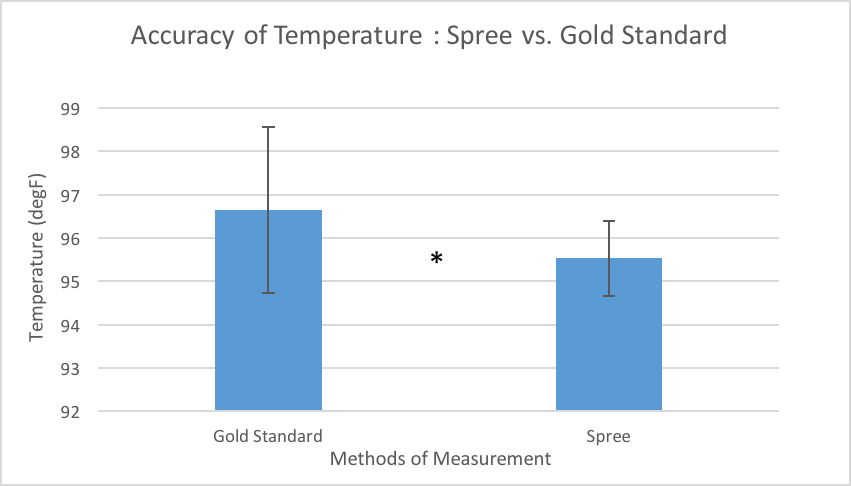
The p-value was determined using Excel: HEART RATE The p-value of the heart rate, being much larger than 0.05, indicates that the difference between the two data sets (Gold Standard and Spree) is NOT significant. That is, the Spree is a relatively accurate (as it is comparatively close to the Gold Standard), for measuring heart rate. The p-value of the temperature, being much smaller than 0.05, indicates that the difference between the two data sets (Gold Standard and Spree) IS significant. This was demonstrated above in the temperature bar graph with a star. This means that the Spree is not accurate when it comes to measuring human body temperature, when compared to the gold standard.
Design Flaws and RecommendationsThe design flaws of this device are largely concerning its accuracy when it comes to measuring body temperature (see Inferential Statistics section). This may be due to the fact that it is an external device, thus making it harder to accurately measure body temperature (which is more constant and warmer on the inside of the body). In addition, the fact that the measurements are rounded to the nearest whole number, whereas the Gold Standard measurements were rounded to the nearest tenth, would definitely have impacted the accuracy of the readings by introducing more rounding error, and thus more discrepancy between the Spree and the Gold Standard measurements.
Experimental Design of Own DeviceFor our experiment, the UV senor we will create will have to be compared to another UV sensor that has been proven to be accurate. We would have multiple trials testing the tattoo in different age groups, times of day, amount of exposure, and different climates. These would be the independent variables, with the color change of the tattoo being the dependent variable, as this indicates the amount of UV exposure. This data would be compared with the other product's data to determine if it is statistically significant. NOTE: Rubric: make sure to include everything on the rubric! "Considers the appropriate groups, sample size, inferential statistics, etc. and provide rationale for decisions" | ||||||