BME100 s2014:W Group2 L3
| Home People Lab Write-Up 1 | Lab Write-Up 2 | Lab Write-Up 3 Lab Write-Up 4 | Lab Write-Up 5 | Lab Write-Up 6 Course Logistics For Instructors Photos Wiki Editing Help | ||||||
OUR TEAM
LAB 3A WRITE-UPDescriptive StatisticsOral Mean(Degrees F)=97.07882736 Sensor Mean(Degrees F)=96.49491525 Oral standard deviation= 1.075563962 Sensor standard deviation= 2.027951593
P Value to achieve significance=0.05 Significant? Yes Pearson's R=0.200412054
Cuff Mean= 117.7782 Watch Mean= 112.3109 Cuff standard deviation= 18.91459 Watch standard deviation= 13.50832
P Value to achieve significance=0.05 Significant? Yes Pearson's R=0.147933
Pulse Oximeter Mean(beats per minute)= 88.31004 Watch Mean(beats per minute)= 86.67647 Pulse Oximeter standard deviation= 13.91709 Watch standard deviation= 16.1711
P Value to achieve significance=0.05 Significant? No Pearson's R=0.710135
Results
AnalysisWith regards to the temperature data, we have found a discrepancy in the readings of the oral thermometer and the body temperature sensor. The average of the oral readings was around 97.07 degrees Fahrenheit whereas the average for the sensor was 96.49 degrees Fahrenheit. The standard deviation for the oral was 1.0755 degrees Fahrenheit whereas the standard deviation for the body sensor was 2.0279 Fahrenheit. A T-Test was run for the data which yielded a number of 3.91379E-6. The number to achieve a statistical significance is .05, so the data was significant. The Pearson's R yielded a number of .2004 which indicates that the two variables tested have a slightly positive correlation. For blood pressure, there was also a discrepancy in the data sets. The mean of the cuff was 117.78 mmHg whereas the mean of the watch was about 112.31 mmHg. The standard deviation of the cuff was 18.91 mmHg while the standard deviation of the watch was 13.51 mmHg. When the T-Test was run, it yielded a number of 2.97E-6. The number to achieve significance is .05 and the number is well under that so the data is significant. In order to find the correlation of the variables the Pearson's R was run and came out to be .1479. This means the variables tested had very little correlation. For heart rate, there was a slight discrepancy in the readings. The mean of the pulse oximiter was 88.31 bpm whereas the mean of the watch was 86.67 bpm. The standard deviation of the pulse oximeter was 13.92 bpm and the standard deviation of the watch was 16.17 bpm. A T-Test was ran and yielded a number of .1198. The number to achieve significance is .05 and the number generated is above that which shows the data is not significant. In order to find the correlation between the variables, a Pearson's R was run and yielded a number of .7101 which shows a strong correlation between the variable sets.
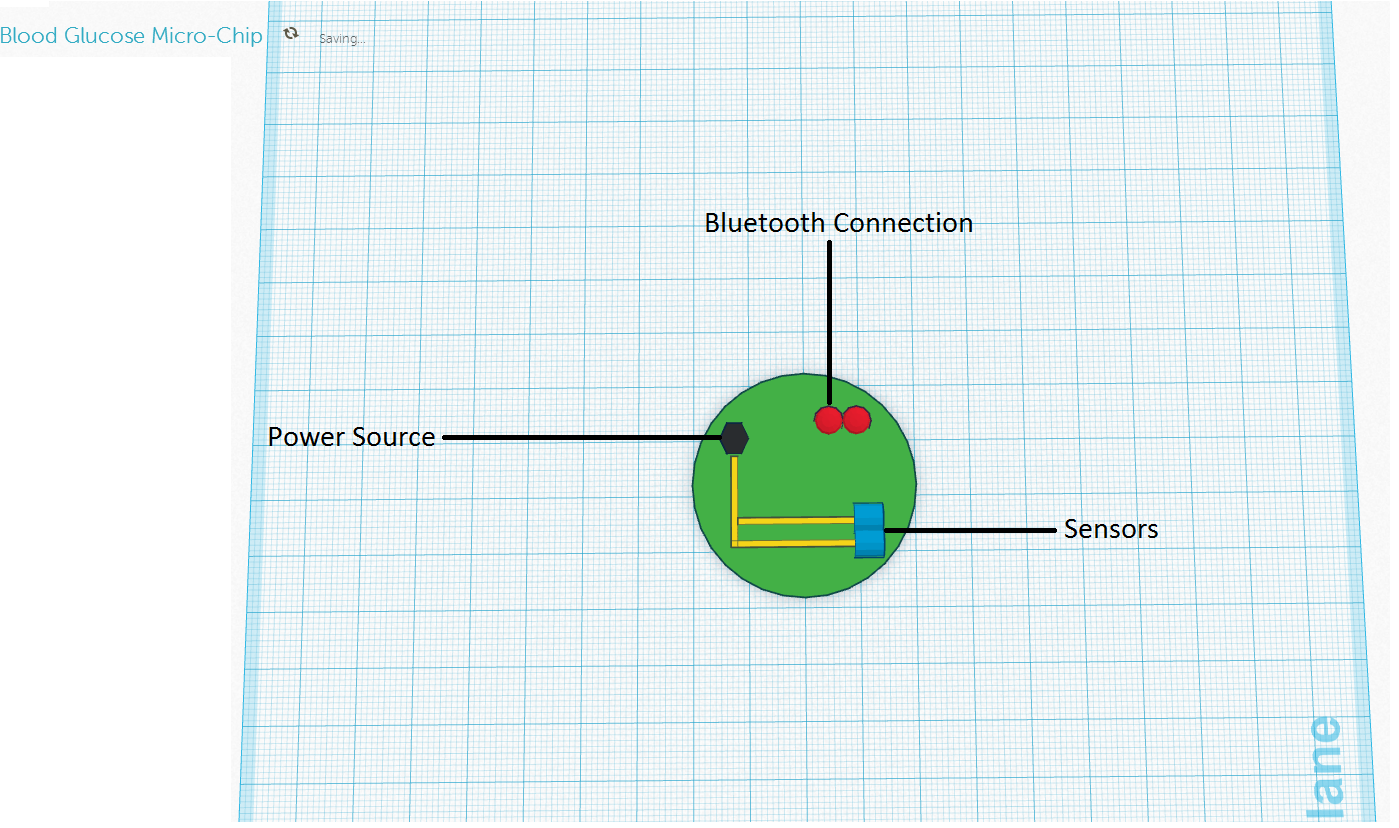
Summary/DiscussionThere are various ways to take a person's temperature; for this experiment we used a mouth (oral) and armpit (axillary) thermometer. The temperature readings vary depending on which one you use, and you need an accurate body temperature to determine if a fever is present. Generally, the correlation of temperature results by mouth is 98.6 degrees Fahrenheit while the armpit is usually 1 degree Fahrenheit lower than an oral temperature. Our results for the Oral Mean(Degrees F) was 97.08 while the Sensor Mean(Degrees F) was 96.49. The Pearson's R correlation was equal to 0.2 for the body temperature readings. During our experiment we noted that there was a difference between the temperature reading from the sensor and the oral thermometer as much as 3 degrees different. Our recommendations for the Raiin Wireless Thermometer and the Vitals Monitor App would be to do more testing and research in order to have the temperature readings more accurate for the user or patient. There has been many devices that are said to tell you what your blood pressure is at any given moment that you want to check. In order to compare different devices we used a blood pressure cuff on one arm while the watch sensor was on the other arm to check blood pressure every few minutes, as well as after an activity such as jogging. During our experiment we found that the watch sensor was inaccurate on almost every reading compared to the blood pressure cuff for both the blood pressure and pulse. Our results for the blood pressure cuff mean was 117.78 and the watch sensor mean was 112.31. The Pearson's R correlation was equal to 0.15 for the blood pressure readings. The pulse oximeter mean (beats per minute) was 88.31 and the watch mean (beats per minute) for the pulse reading was 86.68. The Pearson's R correlation for the pulse readings was equal to 0.71. Our recommendations for the watch sensor device would be to improve the accuracy by having it placed on a different part of the arm that may help to give more accurate blood pressure and pulse readings. Accurate blood pressure measurement is an exacting process that requires careful attention and periodic retraining. All that is needed is the desire to improve devices, a few tools, and the knowledge to do so. LAB 3B WRITE-UPTarget Population and NeedMicrochip Glucose Monitor The target population will be patients with diabetes, insulin problems, and other blood sugar diseases which require blood sugar monitoring. This device will elminate the need for poking the finger to test blood sugar, and will give real-time readings. The device can be linked to a smartphone device or handheld monitor to show blood sugar level readings.
Device Design
Inferential StatisticsGold Standard Mean= 110.65 Blood Glucose Micro Chip Mean= 110 Gold Standard Standard deviation= 30.97 Blood Glucose Micro Chip standard deviation= 31.60
P Value to achieve significance=0.05 Significant? No
Graph
|
||||||


