BME103 s2013:T900 Group2 L2: Difference between revisions
| (28 intermediate revisions by 6 users not shown) | |||
| Line 17: | Line 17: | ||
| [[Image:404005_4622115081677_1186647743_n.jpg|100px|thumb|Mitch Riggs <br> Open PCR Machine Engineer/ Team Leader]] | | [[Image:404005_4622115081677_1186647743_n.jpg|100px|thumb|Mitch Riggs <br> Open PCR Machine Engineer/ Team Leader]] | ||
| [[Image:BME103student.jpg|100px|thumb|Name: William Scott]] | | [[Image:BME103student.jpg|100px|thumb|Name: William Scott]] | ||
| [[Image:BME103student.jpg|100px|thumb|Name: Joe Sansone]] | | [[Image:BME103student.jpg|100px|thumb|Name: Joe Sansone <br> Protocol Specialist]] | ||
| [[Image: | | [[Image:Photo(3).jpg|100px|thumb|Name: Shang Ruan <br> Open PCR Machine Engineer]] | ||
|} | |} | ||
| Line 33: | Line 33: | ||
'''Single-Drop Fluorimeter'''<br> | '''Single-Drop Fluorimeter'''<br> | ||
'' | ''The single drop fluorimeter emits a blue light at the drop of SYBR Green which will fluoresce green if it contains DNA. http://openwetware.org/images/c/c7/2012-11-01_11.53.50.jpg]''<br> | ||
When using it, put your thumb on the button, push it all the way down to squeeze the existed air in it and then collect the SYBR Green. A little plastic tip is used during the liquid collecting so the liquid in different tubes would not mess up with each other. There is a bar for pressing to eject the tip. Do not use fingers to pull it out. <br> | |||
'''How the Fluorescence Technique Works'''<br> | '''How the Fluorescence Technique Works'''<br> | ||
'' | ''A drop of DNA and SYBR Green is collected on a glass slide. A fluorometer is used to shine a blue light on the drop. The drop will fluoresce green light if enough DNA is in the solution. By measuring the amount of green light emitted the amount of DNA in the sample can be determined. Basically, fluorescence is the property of some atoms to absorb some light at a particular wavelength and to subsequently emit light of longer wavelength after a brief interval, it is like choosing students for the admission of the university. The Fluorescence technique is always used to examine or analyze protein-nucleic acid and protein-protein etc.'' | ||
| Line 46: | Line 46: | ||
'''Smart Phone Camera Settings'''<br> | '''Smart Phone Camera Settings'''<br> | ||
* '' | * ''The smartphone used for the camera was the Android Google Nexus 4. An app named Camera Self-Timer was installed to create a window in which the camera can shoot a picture in which the fluorimeter could then be covered in darkness for the most accurate results.'' | ||
** Flash: | ** Flash: No flash was used | ||
** ISO setting: | ** ISO setting: Unknown (could not be altered) | ||
** White Balance: | ** White Balance: White balance was set on auto | ||
** Exposure: | ** Exposure: Exposure was set on auto | ||
** Saturation: | ** Saturation: Saturation was set on high | ||
** Contrast: | ** Contrast: Contrast was set on low | ||
'''Calibration'''<br> | '''Calibration'''<br> | ||
'' | ''The camera was placed on a cradle that was in approximately equal height of the fluorimeter. If the cradle and camera needed to be taller in order to be of equal height to the fluorimeter, the cradle was then placed on a stacked glass case until the camera was parallel. The distance from the cradle to the fluorimeter was about 7 cm. After creating a solution for calibration the camera was then set on a self-timer of 10 seconds and then the fluorimeter was encased in a box and covered for complete darkness for the most accurate results. After the beep indicating that the picture was taken the cycle was then complete and the process was then repeated for each solution. | ||
Image of setup as shown from http://openwetware.org/wiki/BME103'' | |||
<font color="red">***PHOTO REMOVED DUE TO PLAGIARISM*** Original photos from other lab reports should not be reused.</font> | |||
* Distance between the smart phone cradle and drop = '''7cm''' | |||
'''Solutions Used for Calibration' | '''Solutions Used for Calibration''' | ||
{| {{table}} width=700 | {| {{table}} width=700 | ||
|- | |- | ||
| Calf Thymus DNA Solution (microg/mL) || Volume 2X DNA Solution (uL) || Volume SYBR GREEN I Solution (uL)|| Fina DNA concentration in PicoGreen Assay (ng/mL) | | '''Calf Thymus DNA Solution (microg/mL)''' || '''Volume 2X DNA Solution (uL)''' || '''Volume SYBR GREEN I Solution (uL)'''|| '''Fina DNA concentration in PicoGreen Assay (ng/mL)''' | ||
|- | |- | ||
| 5 || 80 || 80 || 2.5 | | 5 || 80 || 80 || 2.5 | ||
| Line 92: | Line 89: | ||
'''Placing Samples onto the Fluorimeter''' | '''Placing Samples onto the Fluorimeter''' | ||
* '' | * '''''Step 1:''' A micro pipette was obtained and 80uL of the SYBR GREEN I was dispensed in the center of the first two rows of the slide. Once done 80uL of the desired solution (calf thymus at various concentrations or just water) was added to the mixture on the slide.'' | ||
* '' | * '''''Step two:''' After the desired mixture was placed onto the slide it was then positioned so that the droplet was centered with the small opening on the apparatus where the blue LED light originates from.'' | ||
* '' | * '''''Step three:''' After collecting the qualitative data with picture captures, the sample was removed from the slide and discarded appropriately. Then the above steps were repeated for all concentrations of DNA making sure not cross contaminate the mixtures by using different slide rows for each trial.'' | ||
* '' | * '''''Step four:''' Once all experimental trials were done the work station was cleaned by discarding the slides in the appropriate sharps container as well as dispensing the DNA solutions appropriately. The data was compiled and tabulated for further analysis. '' | ||
<br> | <br> | ||
| Line 104: | Line 101: | ||
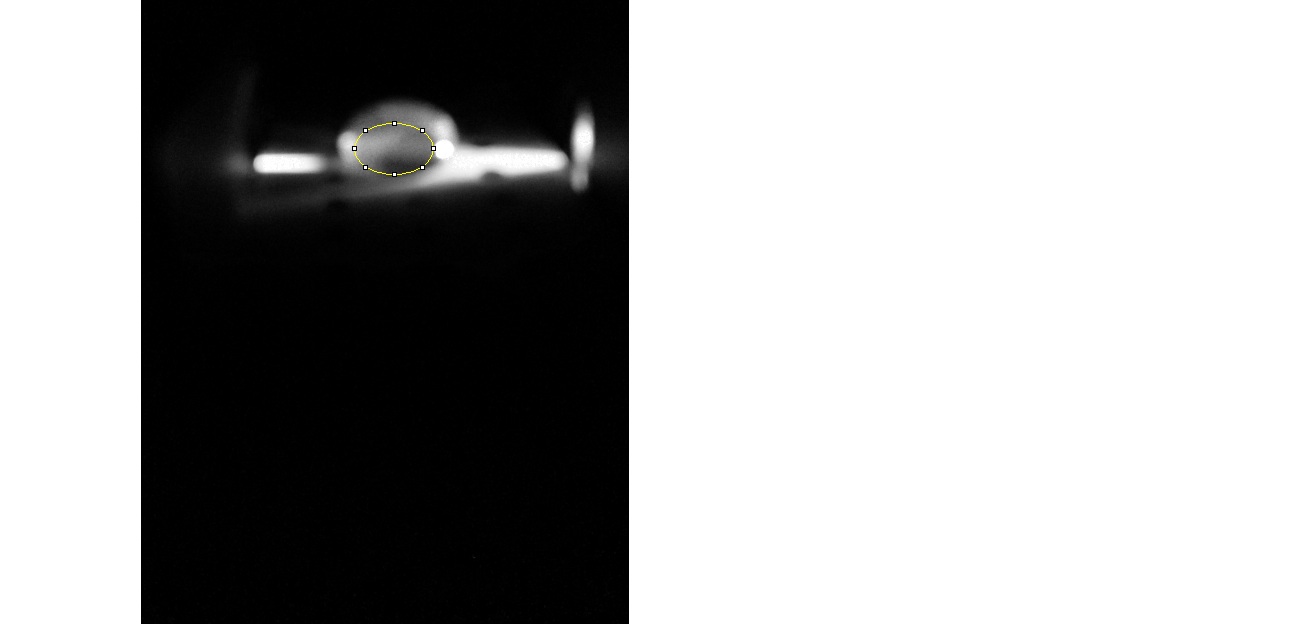
'''Representative Images of Samples''' | '''Representative Images of Samples''' | ||
''[ | ''[Water Droplet (control/blank) http://openwetware.org/images/6/6e/Water_droplet_blank.jpg]'' | ||
''[ | ''[High Concentrated DNA Solution Drop with SYBR Dye http://openwetware.org/images/0/06/High_concentration_DNA_drop.jpg]'' | ||
'''Image J Values for All Samples''' | '''Image J Values for All Samples''''' | ||
{| {{table}} width=700 | {| {{table}} width=700 | ||
|- | |- | ||
| | | DNA final concentration (ng/mL)|| Ave. Mean|| Ave. IntDen | ||
|- | |||
| 2.5 || 109.55 || 4920177 | |||
|- | |||
| 1 || 98.36 || 4687729 | |||
|- | |||
| 0.5 || 58.41 || 2081008 | |||
|- | |||
| 0.25|| 49.45 || 1679326 | |||
|- | |- | ||
| | | 0.125 || 47.1 || 1396192 | ||
|- | |- | ||
| | | 0 || 35.93 || 1195111 | ||
|} | |} | ||
'''Fitting a Straight Line'''<br> | '''Fitting a Straight Line'''<br> | ||
''[ | ''[ Integrated Density of DNA Droplets with SYBR Dye http://openwetware.org/images/7/71/Line_of_best_fit.jpg]'' | ||
Latest revision as of 08:55, 28 June 2013
| Home People Lab Write-Up 1 Lab Write-Up 2 Lab Write-Up 3 Course Logistics For Instructors Photos Wiki Editing Help | |||||||||||||||||||||||||||||||||||||||||||||||||||||||
|
OUR TEAM
LAB 2 WRITE-UPBackground InformationSYBR Green Dye
How the Fluorescence Technique Works
ProcedureSmart Phone Camera Settings
Calibration The camera was placed on a cradle that was in approximately equal height of the fluorimeter. If the cradle and camera needed to be taller in order to be of equal height to the fluorimeter, the cradle was then placed on a stacked glass case until the camera was parallel. The distance from the cradle to the fluorimeter was about 7 cm. After creating a solution for calibration the camera was then set on a self-timer of 10 seconds and then the fluorimeter was encased in a box and covered for complete darkness for the most accurate results. After the beep indicating that the picture was taken the cycle was then complete and the process was then repeated for each solution. Image of setup as shown from http://openwetware.org/wiki/BME103 ***PHOTO REMOVED DUE TO PLAGIARISM*** Original photos from other lab reports should not be reused.
Solutions Used for Calibration
Placing Samples onto the Fluorimeter
Data AnalysisRepresentative Images of Samples [Water Droplet (control/blank) http://openwetware.org/images/6/6e/Water_droplet_blank.jpg] [High Concentrated DNA Solution Drop with SYBR Dye http://openwetware.org/images/0/06/High_concentration_DNA_drop.jpg]
Image J Values for All Samples
Fitting a Straight Line
| |||||||||||||||||||||||||||||||||||||||||||||||||||||||


.jpg)