BME103 s2013:T900 Group2 L2: Difference between revisions
Shang Ruan (talk | contribs) |
|||
| Line 59: | Line 59: | ||
''The camera was placed on a cradle that was in approximately equal height of the fluorimeter. If the cradle and camera needed to be taller in order to be of equal height to the fluorimeter, the cradle was then placed on a stacked glass case until the camera was parallel. The distance from the cradle to the fluorimeter was about 7 cm. After creating a solution for calibration the camera was then set on a self-timer of 10 seconds and then the fluorimeter was encased in a box and covered for complete darkness for the most accurate results. After the beep indicating that the picture was taken the cycle was then complete and the process was then repeated for each solution. | ''The camera was placed on a cradle that was in approximately equal height of the fluorimeter. If the cradle and camera needed to be taller in order to be of equal height to the fluorimeter, the cradle was then placed on a stacked glass case until the camera was parallel. The distance from the cradle to the fluorimeter was about 7 cm. After creating a solution for calibration the camera was then set on a self-timer of 10 seconds and then the fluorimeter was encased in a box and covered for complete darkness for the most accurate results. After the beep indicating that the picture was taken the cycle was then complete and the process was then repeated for each solution. | ||
Image of setup as shown from http://openwetware.org/wiki/BME103 http://openwetware.org/images/e/e3/BME103_Group9_FluorimeterSetup.jpg'' | Image of setup as shown from http://openwetware.org/wiki/BME103 http://openwetware.org/images/e/e3/BME103_Group9_FluorimeterSetup.jpg'' | ||
<font>***PHOTO REMOVED DUE TO PLAGIARISM***</font> | |||
* Distance between the smart phone cradle and drop = '''7cm''' | * Distance between the smart phone cradle and drop = '''7cm''' | ||
Revision as of 08:50, 28 June 2013
| Home People Lab Write-Up 1 Lab Write-Up 2 Lab Write-Up 3 Course Logistics For Instructors Photos Wiki Editing Help | |||||||||||||||||||||||||||||||||||||||||||||||||||||||
|
OUR TEAM
LAB 2 WRITE-UPBackground InformationSYBR Green Dye
How the Fluorescence Technique Works
ProcedureSmart Phone Camera Settings
Calibration The camera was placed on a cradle that was in approximately equal height of the fluorimeter. If the cradle and camera needed to be taller in order to be of equal height to the fluorimeter, the cradle was then placed on a stacked glass case until the camera was parallel. The distance from the cradle to the fluorimeter was about 7 cm. After creating a solution for calibration the camera was then set on a self-timer of 10 seconds and then the fluorimeter was encased in a box and covered for complete darkness for the most accurate results. After the beep indicating that the picture was taken the cycle was then complete and the process was then repeated for each solution. Image of setup as shown from http://openwetware.org/wiki/BME103 http://openwetware.org/images/e/e3/BME103_Group9_FluorimeterSetup.jpg ***PHOTO REMOVED DUE TO PLAGIARISM***
Solutions Used for Calibration
Placing Samples onto the Fluorimeter
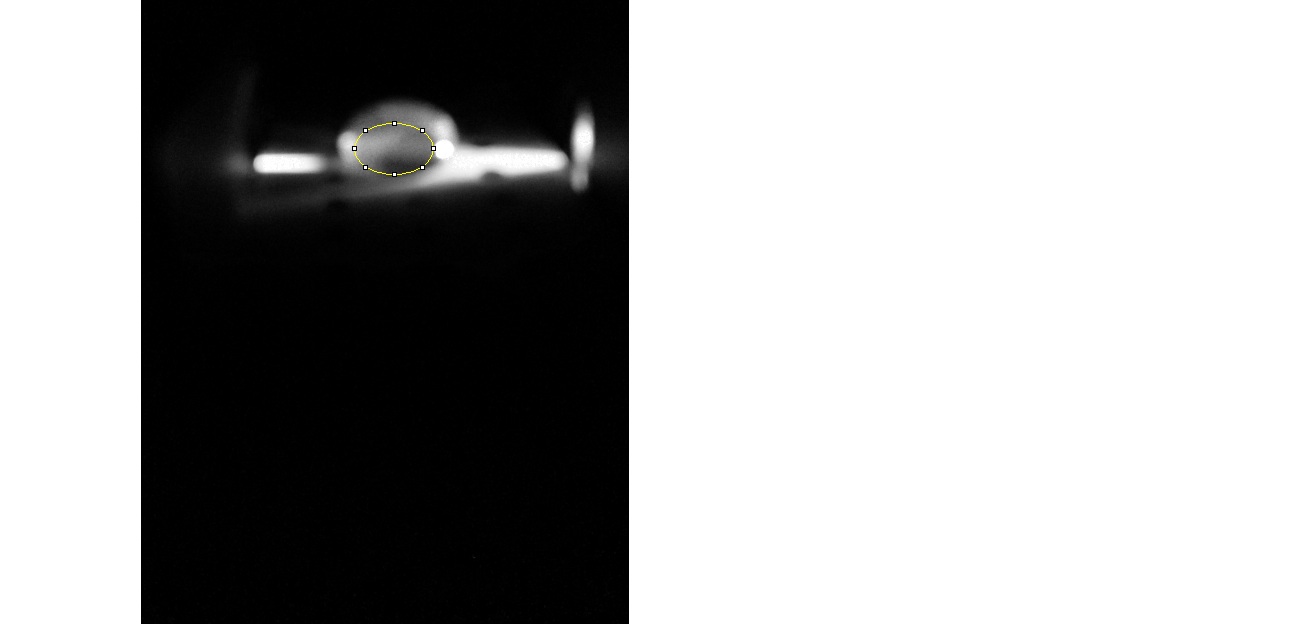
Data AnalysisRepresentative Images of Samples [Water Droplet (control/blank) http://openwetware.org/images/6/6e/Water_droplet_blank.jpg] [High Concentrated DNA Solution Drop with SYBR Dye http://openwetware.org/images/0/06/High_concentration_DNA_drop.jpg]
Image J Values for All Samples
Fitting a Straight Line
| |||||||||||||||||||||||||||||||||||||||||||||||||||||||


.jpg)