The printable version is no longer supported and may have rendering errors. Please update your browser bookmarks and please use the default browser print function instead.
This page contains some data that we have taken with the TX-TL breadboard.
Plasmid Expression of GFP
Using pBEST-OR2-OR1-Pr-UTR1-deGFP-T500, a plasmid enhanced for GFP expression, the biomolecular breadboard is able to express mass at equal concentrations to comparable bacteriophage in-vitro systems (J. Shin and V. Noireaux, 2010).
Expression of plasmids can be optimized by concentration.
|

|
- Raw data file: plasmid_deGFP-070812.xls (Excel spreadsheet)
- Information about protocol on "Outline" sheet; plotted data is on the sheet "plotted-data"
|
Figure 1. eGFP expression as a function of plasmid DNA template. Plasmid DNA pBEST-OR2-OR1-Pr-UTR1-eGFP-T500 is varied by concentration.
|
Protecting Linear DNA from Exonuclease-Mediated Degradation
Current standards for circuit design utilize plasmids for DNA template, which require time-consuming subcloning steps. However, circuits based on linear DNA require only PCR assembly or gene synthesis, which drastically decreases preparation time. As a purely extract-derived system, our biomolecular breadboard exhibits exonuclease activity which degrades linear DNA. We are developing multiple technologies to protect linear DNA from exonuclease degradation. These include:
- Protecting linear DNA using noncoding segments
- Inhibiting RecBCD exonuclease with gamS
- Adding thiosulfate bonds to 5' ends
Protection Sequences
|
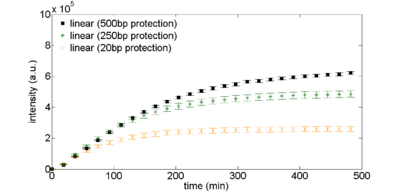
Figure 2: Exonuclease protection using non-coding DNA. Linear DNA templates, 2nM, are derived from plasmid DNA pBEST-OR2-OR1-Pr-UTR1-eGFP-Del6-229-T500 with varying amounts of noncoding DNA surrounding the coding sequence.
|
GamS
|


Figure 3. (left) GamS from lambda phage, an inhibitor of RecBCD complex, inhibits template DNA degradation. Linear DNA templates, 2nM, are derived from plasmid DNA pBEST-OR2-OR1-Pr-UTR1-eGFP-Del6-229-T500. GamS supplied at 3uM concentration. (right) Simulation results based on a simple ODE model.
|
|

Figure 4. eGFP expression as a function of linear DNA template, with gamS. Plasmid DNA pBEST-OR2-OR1-Pr-UTR1-eGFP-Del6-229-T500 is varied by concentration. GamS supplied at 3uM concentration.
|
Thiosulfate Bonds
|

Figure 5. Thiosulfate bonds protect against 5' exonuclease degradation. Linear DNA templates, 2nM, are derived from plasmid DNA pBEST-OR2-OR1-Pr-UTR1-eGFP-Del6-229-T500. 5 thiosulfate bonds are present at each 5' end. GamS supplied at 3uM concentration.
|
Protein Degradation
Implementing protein degradation is integral to enabling the function of many dynamical circuits, such as oscillators or feed-forward loops. We have been exploring the overexpression of AAA ATPases ClpXP to selectively target proteins with degradation tags. Initial experiments indicate that ClpXP, when overexpressed, can accelerate degradation of purified eGFP-ssrA (Fig. 1). We will further characterize this AAA ATPase family, as well as try to demonstrate its use through an incoherent feed-forward loop. We have not been able to replicate the results by adding purified ClpXP protein. However, we intend to express ClpXP off of plasmids or to create custom extract with ClpXP already overexpressed to enable rapid protein degradation.
|

Figure 6. Protein degradation can be increased using endogenous pathways. ClpX and ClpP are AAA proteases which selectively target proteins with proteolytic tags. 763ng of purified eGFP-ssrA is degraded over time in either extract with endogenous amounts of ClpX and ClpP (“control”), or ClpX and ClpP upregulated in a 6:1 ratio (“over-expression”). ClpX and ClpP are encoded on plasmids under an IPTG-inducible T7 promoter. Reaction also incubated with 0.2nM of plasmid encoding for sigma70-driven T7 RNA polymerase. Up to 6-fold increase in degradation rate can be seen.
|
Environmental Context
The TX-TL system can be used to study the operation of circuits in different environmental contexts, including salts, energy levels and temperature.
Magnesium and Potassium concentration
|


Figure 7: Response of two two-stage transcriptional activation cascades as a function of magnesium and potassium. Top: schematic of the circuit where x and y are either σ19 or σ38. Bottom: response of the two circuits as a function of magnesium (A) and potassium (B).
|
Temperature
|

Figure 8: Transient response of a constitutive promoter as a function of temperature.
(A) Schematic illustration and a simple model of a constitutive promoter expressing gfp.
(B) Red blue color map presents preliminary data showing the transient response as a function of temperature. Evaporation dominates at 37 °C. Measurements were acquired over approximately 8 hour duration with indiviudal measurements every 3 minutes.
(C) Red dots represent the dependence of temperature of parameter estimates obtained from this data. These estimates are for the constitutive promoter activity β.
|
|

Figure 9. Transient response of a negative feedback circuit as a function of temperature.
(A) Schematic illustration and simple model of a negative transcriptional feedback circuit based on the autoregulatory effect of the protein fusion TetR-GFP.
(B) Red blue color map presents preliminary data showing the transient response as a function of temperature. Evaporation dominates at 37 °C. Measurements were acquired over approximately 8 hour duration with indiviudal measurements every 3 minutes.
(C) and (D) Red dots represent temperature dependence of parameter estimates obtained from this data. These estimates are for promoter constants β and k.
|


