Chris Rhodes Week 3: Difference between revisions
From OpenWetWare
Jump to navigationJump to search
(sentence corrects) |
No edit summary |
||
| Line 1: | Line 1: | ||
==Methods== | ==Methods== | ||
'''Activity 1 Parts 2 and 3''' | '''Activity 1 Parts 2 and 3''' | ||
*Following the Genbank links from the [http://www.ncbi.nlm.nih.gov/pubmed?term=Patterns%20of%20HIV-1%20Evolution%20in%20individuals%20with%20differing%20rates%20of%20CD4 PubMed article] | *Following the Genbank links under the Secondary Source ID tab from the [http://www.ncbi.nlm.nih.gov/pubmed?term=Patterns%20of%20HIV-1%20Evolution%20in%20individuals%20with%20differing%20rates%20of%20CD4 PubMed article] I added the Fasta sequence of AF016760, AFO016761, AFO016767, AFO016780, and AFO016787 to the [http://workbench.sdsc.edu WorkBench] nucleotide tools and ran a ClustalW multiple sequence allignment using the default parameters: (Note: All ClustalW and Clusdist alignments were performed using the default parameters) | ||
[[Image:CHR_Image1_20110914.jpg|HIV-1 Nucleotide Sequence Alignment]] | [[Image:CHR_Image1_20110914.jpg|HIV-1 Nucleotide Sequence Alignment]] | ||
Revision as of 21:24, 19 September 2011
Methods
Activity 1 Parts 2 and 3
- Following the Genbank links under the Secondary Source ID tab from the PubMed article I added the Fasta sequence of AF016760, AFO016761, AFO016767, AFO016780, and AFO016787 to the WorkBench nucleotide tools and ran a ClustalW multiple sequence allignment using the default parameters: (Note: All ClustalW and Clusdist alignments were performed using the default parameters)

The blue regions of the alignment represent where the nucleotides of the different sequences all match each other while the black regions represent an area where one nucleotide of at least one sequence differs from the nucleotides of the other sequences in the alignment.
- I also looked at the unrooted genetic tree and took a screenshot:

The genetic tree shows the relative difference between all the sequences in the alignment through the use of distance on the tree. The closer the sequences are to each other the more similar the sequences are to each other.
Activity 2 Part 1
- I added all of the nucleic acid sequences of both .txt files onto the Workbench by uploading each .txt file into the nucleotide sequences section of Workbench. The .txt files can be found here HIV-1 In-Class Activity Page under the background section along with a link to the Activity handout and the general requirements of the assignment.
- From the sequences I ran a ClustalW allignment of: S12V1-1, S12V1-2, S12V1-3, S13V1-2, S13V1-3, S13V1-4, S14V1-4, S14V1-5, S14V1-6, S15V1-10, S15V1-11, S15V1-12 and took a screenshot of the alignment and the unrooted genetic tree:


Activity 2 Part 2
- To calculate the S value of a particular alignment I selected all of Subject 8's clones and ran a ClustalW alignment. The S value corresponds to the number of nucleotide sites that differ between any of the sequences aligned. For our purposes the S value can be found by counting the number of black columns throughout the ClustalW alignment.

- An alignment was also done for Subject 9

- and Subject 10

- From these alignments and using the equations given in the Activity Handout S and Theta were calculated.
- By using the equations given in the Activity Handout and the Clustdist tool under the Alignment Tools section for each alignment the Min and Max differences were determined. (See Single Subject Alignment Table below)
- Clustdist of Subject 8

- Clustdist of Subject 9

- Clustdist of Subject 10
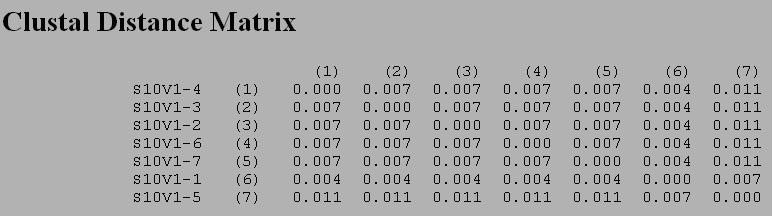


Activity 2, Part 2: Single Subject Alignment Table'
Subject  Clones  S  Theta  Min-Diff.  Max-Diff.
8        5       6  2.88   1.14       5.13
9        5       5  2.44   1.99       3.99
10       7       7  2.86   1.14       3.14
- Using Subjects 12 and 13 I created and saved a new ClustalW alignment to check the Min and Max differences across subjects by using Clustdist.
- Subject 12 and 13 Alignment
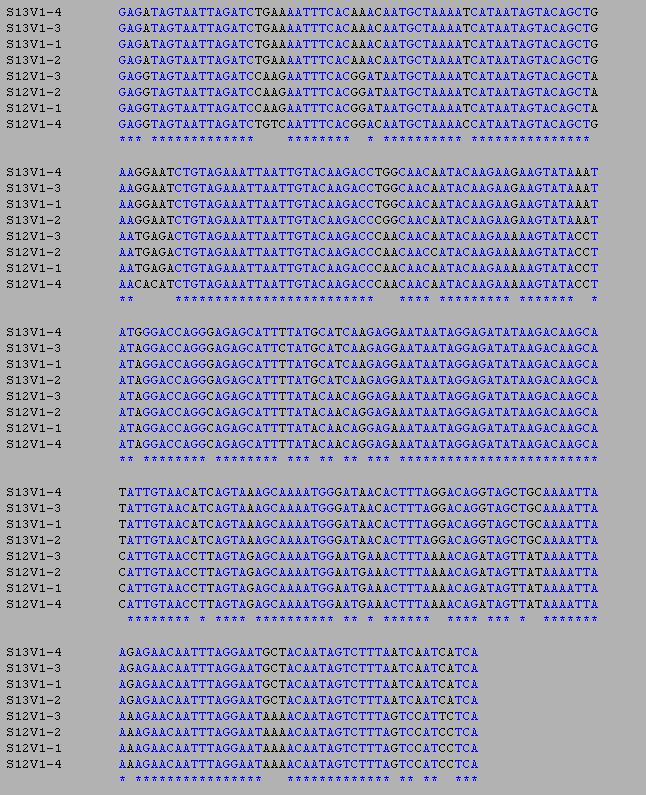
- Subject 12 and 13 Clusdist

- This was repeated using a Subject 8 and 9 alignment and a Subject 8 and 10 alignment.
- Subject 8 and 9 Clustdist

- Subject 8 and 10 Clustdist

- Using the Clustdist of all the cross subject alignments the Min and Max differences for each were calculated. (Below)


Activity 2, Part 2: Cross Subject Alignment Table'
Subject Crosses  Min-Diff.  Max-Diff.
12 and 13        39.05      43.89
8 and 9          27.93      33.06
8 and 10         27.1       31.07
Questions
Activity 1, Part 2: GenBank
- AF016760, AFO016761, AFO016767, AFO016780, and AFO016787
- These gene sequences all came from subject 1
Activity 2, Part 1
- Clones from each subject tend to cluster together on the unrooted genetic tree
- Some subject clusters are much closer to each other on the tree than others specifically Subjects 13,14,and 15
- From the pattern of clustering seen in the genetic tree it seems that the genetic tree separates individual sequences based on their similarity to each other. The closer one sequence is to another on the tree, the more closely those two sequences are related to each other in terms of sequence similarity or evolutionary time.
Markham Paper Prep
- Vocab List
- Seroconverting:
- Sanger chain termination:
- Chris Rhodes User Page
- Week 2 Journal
- Week 3 Journal
- Week 4 Journal
- Week 5 Journal
- Week 6 Journal
- Week 7 Journal
- Week 8 Journal
- Week 9 Journal
- Week 10 Journal
- Week 11 Journal
- Week 12 Journal
- Week 13 Journal
- Week 14 Journal
- Home Page
- Week 5 Assignment Page
- Week 6 Assignment Page
- Week 7 Assignment Page
- Week 8 Assignment Page
- Week 9 Assignment Page
- Week 10 Assignment Page
- Week 11 Assignment Page
- Week 12 Assignment Page
- Week 13 Assignment Page
- Week 14 Assignment Page