Chris Rhodes Week 9: Difference between revisions
No edit summary |
No edit summary |
||
| Line 61: | Line 61: | ||
'''Kwong gp120''' | '''Kwong gp120''' | ||
[[Image:CHR_Image1_20111031.png | Kwong gp120]] | [[Image:CHR_Image1_20111031.png | Kwong gp120]] | ||
'''Stanfield 1999 V3 Aib''' | '''Stanfield 1999 V3 Aib''' | ||
[[Image:CHR_Image2_20111031.png | Stanfield 1999 V3]] | [[Image:CHR_Image2_20111031.png | Stanfield 1999 V3]] | ||
'''Stanfield 2003 V3''' | '''Stanfield 2003 V3''' | ||
[[Image:CHR_Image3_20111031.png | Stanfield 2003 V3]] | [[Image:CHR_Image3_20111031.png | Stanfield 2003 V3]] | ||
| Line 72: | Line 75: | ||
The 3-D structures of the proteins are visualized by downloading the structure files into Cn3D. Using the tools of Cn3D, the secondary structures of the proteins were compared to the predictions made by PSPIRED shown above as a measure of accuracy of the PSPIRED predictions. The C and N termini are shown highlighted in yellow with the C terminus on the right and the N terminus on the left. The side chains are not shown in order to make viewing the termini easier since cysteine's side chains are also colored in yellow. | The 3-D structures of the proteins are visualized by downloading the structure files into Cn3D. Using the tools of Cn3D, the secondary structures of the proteins were compared to the predictions made by PSPIRED shown above as a measure of accuracy of the PSPIRED predictions. The C and N termini are shown highlighted in yellow with the C terminus on the right and the N terminus on the left. The side chains are not shown in order to make viewing the termini easier since cysteine's side chains are also colored in yellow. | ||
'''Kwong gp120''' | |||
[[Image:CHR_Image4_20111031.png | Kwong gp120]] | [[Image:CHR_Image4_20111031.png | Kwong gp120]] | ||
'''Stanfield 1999 V3 Aib''' | |||
[[Image:CHR_Image5_20111031.png | Stanfield 1999 V3]] | [[Image:CHR_Image5_20111031.png | Stanfield 1999 V3]] | ||
'''Stanfield 2003 V3''' | |||
[[Image:CHR_Image6_20111031.png | Stanfield 2003 V3]] | [[Image:CHR_Image6_20111031.png | Stanfield 2003 V3]] | ||
*Though not shown in the pictures, after comparing the secondary structures of the 3D renderings to the PSPRIED secondary structure predictions it was found that PSPIRED was correct for all structural predictions for each of the three proteins. | |||
==Project Presentation== | ==Project Presentation== | ||
Revision as of 12:57, 1 November 2011
Methods
- In order to work with the amino acid sequences of the subjects from the Markham paper each subject's amino acid data was uploaded onto Workbench
- Since our primary understanding of the functional significance of the gp120 amino acid residues is based on the Kwong and Stanfield papers our results can only be interpreted if they coincide with the data we've gathered from these papers. Therefore using the protein data of the sequences from the Kwong and Stanfield papers we will find the regions within the Markham amino acid sequences whose results can be related back to the data of the Kwong and Stanfield papers. This experiment will only look at amino acid changes that occur within these regions.
- Individual ClustalW alignments were performed between all the amino acid sequences of a particular subject and the amino acid sequences of the proteins used in the Kwong and Stanfield papers in order to identify regions of possible functional significance in the amino acid sequences of the subjects. The Kwong and Stanfield sequences can be found here: Kwong, Stanfield 1999 Aib, Stanfield 1999 His/Ser Loop, Stanfield 2003
- Regions of functional significance were determined as highly conserved consecutive sequence areas in the alignments between the subject and the Kwong and Stanfield sequences. Examples of the determination of these regions for Subject 13 are shown below where the regions of functional significance are shown within the green boxes.
- For Subject 13 the regions of possible functional significance were found to be residues 1-23, 37-51, and 61-95 of Subject 13's amino sequences. Any significant changes in the residues of the Subject 13 amino acid sequences that occur within these region will be considered to be of functional significance.
- For each subject, both the amount of changes that occur and the exact amino acid substitution that occurs for each change within the regions of functional significance will be recorded. Based on the type of amino acid change that occurs for each residue the change will be hypothesized to be either functionally significant or non-functionally significant.
- Phylogenetic trees of the amino acid sequences, generated through ClustalW alignments, will also be used to aid in determining which amino acid sequences to use when comparing for functional differences.
Subject 13
Rooted Tree
ClustalW alignment of Subject 13 with regions of functional significance shown in red
Table of Amino Acid Residue Changes for Visits 4 and 5
Sequence      1st Residue Change    2nd    3rd    4th
V4-1           N->H                 R->K   E->G   R->G
V4-2           R->K                 Q->K   R->G    -
V4-3           N->H                 R->K   R->G    -
V4-4           R->K                 Q->K   R->G    -
V4-5           R->G                  -      -      -
V4-6           N->H                 E->K   R->G    -
V4-7           E->K                 R->G    -      -
V5-1           R->G                  -      -      -
V5-2           R->G                  -      -      -
V5-3           S->F                 R->G    -      -
V5-4           G->R                  -      -      -
V5-5           R->G                 R->K    -      -
V5-6           I->T                 G->R    -      -
Subject 7
Rooted Tree
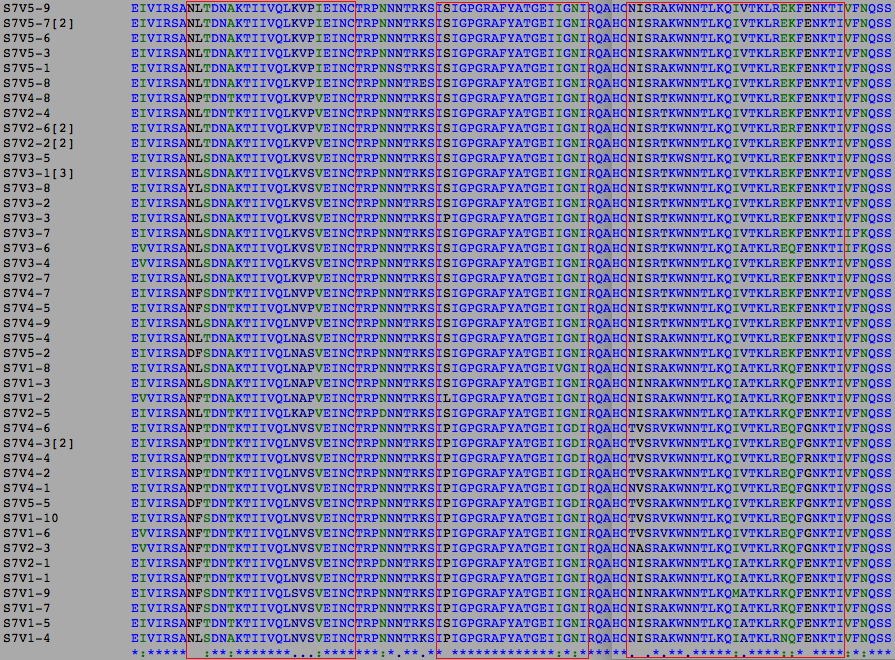
ClustalW alignment of Subject 7 sequences with regions of functional ignificance shown in red
Table of Conserved Residue Changes Between Subject 7 Visits
Visit #    1st Conserved Change       2nd     3rd     4th     5th      6th     7th     8th     9th
4             L->P                    A->T    K->N    S->P    N->D     N->T    I->V    K->Q    E->G
3             T->S                    A->T     -       -       -        -       -       -
5             V->I                    S->P     -       -       -        -       -       -
- Based on the phylogenetic tree the clones we decided to study for Subject 7 are: All of visit 3, V4-1, V4-2, V4-3, V4-4, V4-6, V5-1, V5-3, V5-6, V5-7, V5-8, and V5-9.Due to the large amount of amino acid sequences we studied for subject 7 it would have been unreasonable to list every individual change of every individual amino acid sequence. Instead This table only lists residue changes that were conserved throughout every amino acid sequence of each visit. It is also more likely that these conserved residue changes are more indicative of functional changes between the visits.
Interpretations
Based on the results gathered it appears that the visit 5 and visit 3 sequences are actually quite similar to each other. Between the two visits there are only 4 conserved changes and of these changes only 2 could be considered functionally relevant. This is in contrast with the results of comparing visit 5 or 3's sequences with the visit 4 sequences where between the visit 4 sequences and either visit 5 or visit 3 there are 11 conserved changes and many of them functionally relevant. From these results it is clear that the visit 4 sequences will show major functional differences when compared to the chosen sequences from visits 5 or 3. It also seems that the visit 5 and 3 sequences may be closely related, though they may differ slightly in function. From previous research it was hypothesized that the visit 3 strains were wiped out by the immune system never to be seen again. It is possible however, that instead of disappearing entirely, a small amount of the visit 3 strains survived, mutated, and re-emerged as the visit 5 sequences explaining why we see such large residue conservation between the two. If this is the case, then the previous hypothesis that Subject 7 follows a best fit model of viral progression can be considered to be accurate and given the severe differences between visit 4 and visits 3 and 5, the similarity between visits 3 and 5, and the pattern of the phylogenetic tree it can be said that the visit 4 constitutes the best fit viral sequence. This indicates that since the functions of visits 3 and 5 are so divergent from visit 4 it is most likely that we would see a disappearance of the visit 5 sequences if a hypothetical visit 6 sample was taken from Subject 7 just as we saw a disappearance of the visit 3 sequences.
Structure Data
Secondary Structure Predictions of gp120 and V3 Sequences
The secondary structure predictions were made by inputting the amino acid sequences of the proteins into PSPIRED. The prediction outputs are shown below:
Kwong gp120
Stanfield 1999 V3 Aib
Stanfield 2003 V3
3-D Structures of gp120 and V3 Sequences
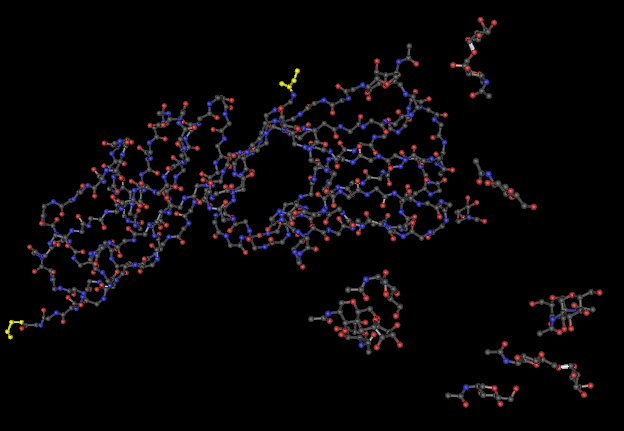
The 3-D structures of the proteins are visualized by downloading the structure files into Cn3D. Using the tools of Cn3D, the secondary structures of the proteins were compared to the predictions made by PSPIRED shown above as a measure of accuracy of the PSPIRED predictions. The C and N termini are shown highlighted in yellow with the C terminus on the right and the N terminus on the left. The side chains are not shown in order to make viewing the termini easier since cysteine's side chains are also colored in yellow.
Kwong gp120
Stanfield 1999 V3 Aib
Stanfield 2003 V3
- Though not shown in the pictures, after comparing the secondary structures of the 3D renderings to the PSPRIED secondary structure predictions it was found that PSPIRED was correct for all structural predictions for each of the three proteins.
Project Presentation
CRIC HIV Structure Experiment Presentation
Links
- Chris Rhodes User Page
- Week 2 Journal
- Week 3 Journal
- Week 4 Journal
- Week 5 Journal
- Week 6 Journal
- Week 7 Journal
- Week 8 Journal
- Week 9 Journal
- Week 10 Journal
- Week 11 Journal
- Week 12 Journal
- Week 13 Journal
- Week 14 Journal
- Home Page
- Week 5 Assignment Page
- Week 6 Assignment Page
- Week 7 Assignment Page
- Week 8 Assignment Page
- Week 9 Assignment Page
- Week 10 Assignment Page
- Week 11 Assignment Page
- Week 12 Assignment Page
- Week 13 Assignment Page
- Week 14 Assignment Page


