Individual Journal Week 3: Difference between revisions
From OpenWetWare
Jump to navigationJump to search
| (3 intermediate revisions by the same user not shown) | |||
| Line 1: | Line 1: | ||
==Initial Chemostat Graph== | ==Initial Chemostat Graph== | ||
x-axis: time | |||
y-axis: concentration | |||
[[Image:chemostat.1.ho]] | [[Image:chemostat.1.ho]] | ||
<table border="1"> | <table border="1"> | ||
| Line 112: | Line 114: | ||
<td>V</td> | <td>V</td> | ||
<td>0.5</td> | <td>0.5</td> | ||
</tr> | </tr> | ||
</table> | </table> | ||
| Line 145: | Line 143: | ||
<td>V</td> | <td>V</td> | ||
<td>0.5</td> | <td>0.5</td> | ||
</tr> | </tr> | ||
</table> | </table> | ||
| Line 178: | Line 172: | ||
<td>V</td> | <td>V</td> | ||
<td>1.0</td> | <td>1.0</td> | ||
</tr> | </tr> | ||
</table> | </table> | ||
Revision as of 18:20, 7 February 2013
Initial Chemostat Graph
x-axis: time
y-axis: concentration
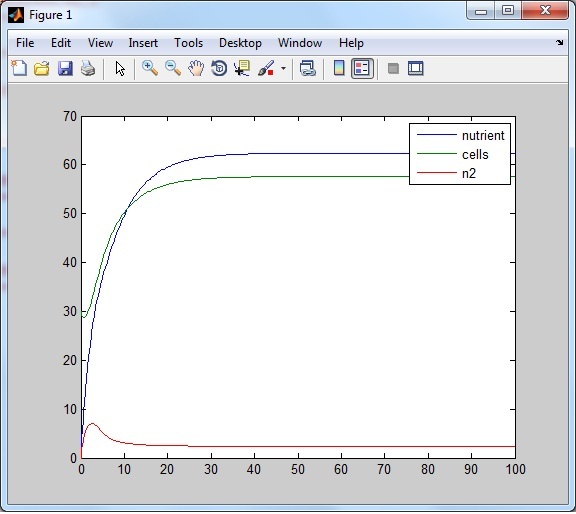
| Variable | Value |
|---|---|
| Q | 0.15 |
| U | 120 |
| R | 1.0 |
| K | 5 |
| V | 0.5 |
Increase in q

| Variable | Value |
|---|---|
| Q | 0.3 |
| U | 120 |
| R | 1.0 |
| K | 5 |
| V | 0.5 |
Increase in u

| Variable | Value |
|---|---|
| Q | 0.15 |
| U | 240 |
| R | 1.0 |
| K | 5 |
| V | 0.5 |
Increase in r

| Variable | Value |
|---|---|
| Q | 0.15 |
| U | 120 |
| R | 2.0 |
| K | 5 |
| V | 0.5 |
Increase in K

| Variable | Value |
|---|---|
| Q | 0.15 |
| U | 120 |
| R | 1.0 |
| K | 10 |
| V | 0.5 |
Increase in V

| Variable | Value |
|---|---|
| Q | 0.15 |
| U | 120 |
| R | 1.0 |
| K | 5 |
| V | 1.0 |