Physics307L:People/Franco/Rough Draft for Final Report: Difference between revisions
| Line 149: | Line 149: | ||
The experimental value for the Rydberg constant is 1.0975 (+/- .0003) × 10^7 m^-1, and the accepted value is 1.0967758 × 10^7 m−1. The percent difference between the values is 6.6%. | The experimental value for the Rydberg constant is 1.0975 (+/- .0003) × 10^7 m^-1, and the accepted value is 1.0967758 × 10^7 m−1. The percent difference between the values is 6.6%. | ||
''Koch, I did not calculate the value in for deuterium in the first lab of the Balmer series. So, when I take the new and improved data, I will calculate it for deuterium.'' | ''Koch, I did not calculate the value in for deuterium in the first lab of the Balmer series. So, when I take the new and improved data, I will calculate it for deuterium here in this spot.'' | ||
==References== | ==References== | ||
Revision as of 22:48, 20 November 2008
Balmer Series Analysis and Determination of the Rydberg Constant
Author: Manuel Franco Jr.
Experimentalist: David Sosa and Manuel Franco Jr.
Location: Albuquerque, New Mexico, 87131, United States
University of New Mexico Department of Physics and Astronomy
800 Yale Blvd. NE
Room Number: 116
E-mail: eMJeF_2004@hotmail.com
Abstract
In this experiment, we determined the Rydberg Constant, compared hydrogen and deuterium, and analyzed the Balmer series. We compare our experimental value to the accepted value R = 1.0967758 × 10⁷ m−1. We did this by using four wavelengths of the spectral line emissions of hydrogen in the Balmer series. These colors "reflect emissions of photons by electrons in excited states transitioning to the quantum level described by the principal quantum number n equals 2." (1) Hydrogen and deuterium are compared to each other, and their experimental values are also compared to their accepted values. In running through the data concepts from the Balmer serious arise that contribute to the experiment. These concepts consist that "the Balmer series is characterized by the electron transitioning from n ≥ 3 to n = 2, where n refers to the radial quantum number or principal quantum number of the electron." (1)
Introduction
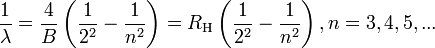
In 1885, Johann Jakob Balmer, a mathematician, discovered this series of colors of hydrogen in the color spectrum, hence the Balmer series. He derived such equation based on his observations: http://upload.wikimedia.org/math/1/2/2/1223c57e48b6b6c0cf038dd69a22db64.png [1]
Three years after the discover of this series, Johannes Robert Rydberg, a physicist, would revise the equation and analyze the details of this phenomena. He would revise the equation to what we commonly known today: http://upload.wikimedia.org/math/0/a/c/0acd60cdab573b571c1a07ee23a8c0d7.png
He used this formula "to predict the wavelengths of photons... emitted by changes in the energy level of an electron in an atom." [2] He would later discover the constant slope in the wavelength over the quantum number transitions.
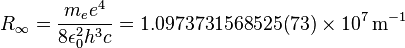
He found the slope to be: http://upload.wikimedia.org/math/7/b/6/7b625152ea50ad187556f8d158b79aff.png
The constants are as follows:
[math]\displaystyle{ h \ }[/math] is the Planck's constant,
[math]\displaystyle{ m_e \ }[/math] is the rest mass of the electron,
[math]\displaystyle{ e \ }[/math] is the elementary charge,
[math]\displaystyle{ c \ }[/math] is the speed of light in vacuum, and
[math]\displaystyle{ \epsilon_0 \ }[/math] is the permittivity of free space. [3]
Apparently, both Johann and Johannes were Swiss, and both contributed to this discovery.
Method and Materials
Equipment
In this experiment we used a constant deviation spectrometer with a Pellin-Broca constant-deviation prism [4], a spectrum tube power supply [5], and 3 spectral line tubes of three different elements: Hydrogen, Deuterium, Mercury. Details of the materials used are in links. We began by making sure that all instruments were functioning correctly, and (most importantly)made sure that we were in a safe environment. We next plugged in the power supply, and inserted the Hg tube as instructed by the manual. Turn on the apparatus and allow it to heat for about a minute or so.
Calibration
After setting up the equipment, we first start off by calibrating the spectrometer by using mercury (Hg) and the table of spectral lines of Hg (Lab Manual: Section 4.3).
Hg Spectral Lines
| Color | Wavelengths |
|---|---|
| Deep Violet | 404.7 nm (hard to see) |
| Violet | 435.8 nm |
| Blue-Green | Skipped (very weak) |
| Green | 546.1 nm |
| Yellow | 577.04 nm |
| Yellow | 579.0 nm |
| Red | 690.75 nm |
We first set the dial one of the wavelengths in the above table. We used the violet color because our data would deviate based on our initial calibration. Since violet is centric it would minimize data instrumental error. We used the other colors to confirm that it's properly calibrated. Then we aligned the colors using the cross hairs in the eyepiece. We adjusted the prism to align the cross hairs with the color as need. Once we calibrated the spectrometer, we adjusted the slit at the other end of the spectrometer to .7 mm. We adjusted the slit as we saw fit later on, but we stayed within the bounds of .5 and 1 mm. The narrower the slit, the color had a higher resolution, but the wider the slit, the color was somewhat blurred. As we were calibrating, Koch mention the us that the gears in the dial have what is called backlash. Backlash is were if you turn the dial clockwise, take a measurement, then counterclockwise there will be gap that will deviate your measurements. So when the spectrometer is calibrated, turn it going counterclockwise or clockwise and take measurements based on that initial direction. If you manage to pass your measurement, go back passing the measurement, and then turn it again stopping at the measurement. Stick to the original direction. All the data measurements have to be taken the same way initially. If we were to take a data point clockwise, or opposite to direction we initially used to calibrate, our data would be off by about 1 nm.
Hydrogen Spectrum Tube
Once we calibrated and backlash was reduced, we turn the power supply off. Then we change the Hg tube with the H tube. (CAUTION: The test tubes will get hot after extended periods of use. Minor burn is possible when handling them!) We turned the power supply back on. We will now record the wavelengths seen through the eye piece based on the Hydrogen. There are four bright and distinct lines: red, turquoise, bright violet, and a diminished violet. We saw something similar to this:

Deuterium Spectrum Tube
After taking several measurements of the wavelength from hydrogen, we repeat the process of replacing the test tubes. This time we took measurements from deuterium. The same colors appear as in hydrogen, and the wavelengths are about the same.
Data
The following measurements are the wavelengths for hydrogen and deuterium. The data was taken counterclockwise.
Hydrogen Measurements
| Color | Measurement 1 (nm) | Measurement 2 (nm) | Measurement 3 (nm) | Measurement 4 (nm) |
|---|---|---|---|---|
| Red | 657.8 | 659.9 | 659.5 | 659 |
| Blue/Green | 486 | 486 | 486.1 | 485.9 |
| Violet | 433.8 | 434 | 434.2 | 434.4 |
| Dim. Violet | 409.7 | 409.8 | 409.3 | 410.1 |
Deuterium Measurements
| Color | Measurement 1 (nm) | Measurement 2 (nm) | Measurement 3 (nm) | Measurement 4 (nm) |
|---|---|---|---|---|
| Red | 659 | 659.9 | 659.5 | 658.1 |
| Blue/Green | 485.9 | 485.9 | 486 | 486 |
| Violet | 434.2 | 434.2 | 434.2 | 434.2 |
| Dim. Violet | 409.8 | 409.7 | 409.8 | 409.3 |
Results and Discussion
Wavelengths of H and D
This is the Spread Sheet 1 in where I did all my data analysis for hydrogen and deuterium. The following table shows the colors of each wavelength with the averages and the uncertainties. I took the data and found an average for all corresponding wavelengths. Also found their S.E.M. (standard error of the mean), by taking the standard deviation of the mean and dividing the square root of the total number of data points.
| Color | Wavelengths for H | Wavelengths for D |
|---|---|---|
| Red | 656.1 +/- .5 nm | 659.13 +/- .03 nm |
| Blue/Green | 486.00 +/- .04 nm | 485.95 +/- 0.03 nm |
| Violet | 434.1 +/- .1 nm | 434.2 +/- 0.1 nm |
| Dim. Violet | 409.7 +/- .1 nm |
409.65 +/- .12 nm |
Determining the Rydberg constant
As for the Rydberg constant, I found the constant in this word Spread Sheet 2, and I obtained this graph for hydrogen. The calculated slope is 1.0975 (+/- .0003) × 10^7 m^-1.

I used this equation to find the slope http://upload.wikimedia.org/math/5/a/0/5a05645dc256a0aca0ab1c9cf97b6525.png [7].
I went through and calculated the individual slopes of each hydrogen wavelength, and compared it to the accepted value.

Conclusions
The experimental value for the Rydberg constant is 1.0975 (+/- .0003) × 10^7 m^-1, and the accepted value is 1.0967758 × 10^7 m−1. The percent difference between the values is 6.6%.
Koch, I did not calculate the value in for deuterium in the first lab of the Balmer series. So, when I take the new and improved data, I will calculate it for deuterium here in this spot.
References
(1) Wikipedia article on Balmer Series
Wikipedia article on Rydberg Constant
Acknowledgments
I just want to thank Johann Jakob Balmer and Johannes Rydberg for make this discovery, for without this discovery I would not being doing this. I also wanna thank my my mom, my dad, my brothers, my dog. I want acknowledge Dr. Kock and Aram for taking the time to instruct us and show us how to go about this and other experiments. I want to thank the department of physics and astronomy, a.k.a. PandA, for providing the materials for this experiment.
Links
Question for Koch
- .Why does Rivera take several measurements for mercury?