User:Allison K. Alix/Notebook/Thesis Research/2013/06/27: Difference between revisions
From OpenWetWare
| Line 12: | Line 12: | ||
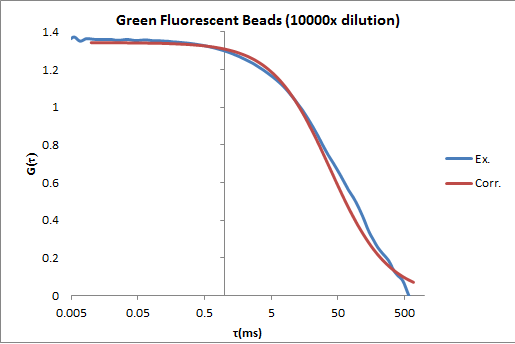
The above fluorescent correlation curve corresponds to a 20uL sample of 10,000x diluted green fluorescent beads. This sample was used to obtain correct alignment of the laser into the sample, as the beads are easily identifiable on the camera. A smooth curve indicates many are present. | The above fluorescent correlation curve corresponds to a 20uL sample of 10,000x diluted green fluorescent beads. This sample was used to obtain correct alignment of the laser into the sample, as the beads are easily identifiable on the camera. A smooth curve indicates many are present. | ||
[[Image:OligioD_calibration_curve_image_OWW.png]] | |||
The above calibration curve corresponds to several concentrations of an oligio-D samples (20pM-100pM). Although there seems to be a linear trend between the 80pM, 60pM, and 40pM, the 100pM and 20pM do not follow this same pattern. Because we are getting SOME indication that concentration and 1/N vary linearly to one another, we are going to prepare these samples once more and take FCS measurements. | |||
<!-- ##### DO NOT edit below this line unless you know what you are doing. ##### --> | <!-- ##### DO NOT edit below this line unless you know what you are doing. ##### --> | ||
Revision as of 08:34, 1 July 2013
| <html><img src="/images/9/94/Report.png" border="0" /></html> Main project page <html><img src="/images/c/c3/Resultset_previous.png" border="0" /></html>Previous entry<html> </html>Next entry<html><img src="/images/5/5c/Resultset_next.png" border="0" /></html> | |
FCS dataThe above fluorescent correlation curve corresponds to a 20uL sample of 10,000x diluted green fluorescent beads. This sample was used to obtain correct alignment of the laser into the sample, as the beads are easily identifiable on the camera. A smooth curve indicates many are present.
The above calibration curve corresponds to several concentrations of an oligio-D samples (20pM-100pM). Although there seems to be a linear trend between the 80pM, 60pM, and 40pM, the 100pM and 20pM do not follow this same pattern. Because we are getting SOME indication that concentration and 1/N vary linearly to one another, we are going to prepare these samples once more and take FCS measurements. | |

