User:Anneliese Faustino/Notebook/671 Nanoparticles/2016/09/14: Difference between revisions
From OpenWetWare
No edit summary |
|||
| Line 25: | Line 25: | ||
[[Image:Ocean Optics Ph 5 part 1 160928.PNG]] | [[Image:Ocean Optics Ph 5 part 1 160928.PNG]] | ||
In the chart above, we see that the maximum absorbance increases over time. | |||
[[Image:Ocean optics ph 5 part 2 160928.PNG]] | [[Image:Ocean optics ph 5 part 2 160928.PNG]] | ||
In the chart above, we see a flat maximum wavelength at about 445 nm until 2800s, where we see a peak and then an increase in maximum wavelength at about 3200 s. The wavelength then plateaus at about 335 nm. | |||
[[Image:Ocean optics ph 5 part 3 160928.PNG]] | [[Image:Ocean optics ph 5 part 3 160928.PNG]] | ||
This chart is similar to the maximum absorbance over time chart as expected. | |||
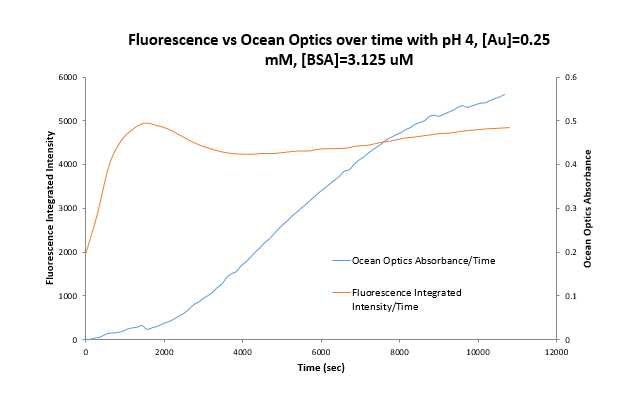
==Comparison of Ocean Optics and Fluorescence for BSA pH4== | ==Comparison of Ocean Optics and Fluorescence for BSA pH4== | ||
Revision as of 09:38, 28 September 2016
| <html><img src="/images/9/94/Report.png" border="0" /></html> Main project page <html><img src="/images/c/c3/Resultset_previous.png" border="0" /></html>Previous entry<html> </html>Next entry<html><img src="/images/5/5c/Resultset_next.png" border="0" /></html> | |
Sample Solution for Ocean Optics 160914
ResultsIn the chart above, we see that the maximum absorbance increases over time. In the chart above, we see a flat maximum wavelength at about 445 nm until 2800s, where we see a peak and then an increase in maximum wavelength at about 3200 s. The wavelength then plateaus at about 335 nm. This chart is similar to the maximum absorbance over time chart as expected. Comparison of Ocean Optics and Fluorescence for BSA pH4The integrated intensity versus time (fluorescence) and the absorbance versus time (Ocean Optics) for BSA pH 4 with 0.25 mM and 3.125 mM BSA were plotted in the same chart. There is a dip in the absorbance (Ocean Optics) as the nanoparticles begin forming (peak fluorescence). | |


