User:Brian P. Josey/Notebook/Junior Lab/2010/10/11: Difference between revisions
(→Data) |
|||
| Line 7: | Line 7: | ||
<!-- ##### DO NOT edit above this line unless you know what you are doing. ##### --> | <!-- ##### DO NOT edit above this line unless you know what you are doing. ##### --> | ||
==Electron Diffraction== | ==Electron Diffraction== | ||
The purpose of this experiment is three fold. The first part is to demonstrate the wave nature of electrons. To do this we passed electrons through a diffraction grating made of graphite at varying voltages and made notes on the resulting patterns on a fluorescent screen. From these patterns, we moved on to the second goal, measuring the de Broglie wavelength of the electrons. This wavelength is given by the relationship λ=h/p. Finally, we attempted to measure the spacing of the graphite from our data, and compare this with the known values for the spacings. Once again, I worked with [[User:Kirstin Grace Harriger|Kirstin]] and her notebook page for this experiment is [[User:Kirstin Grace Harriger/Notebook/Physics 307L/Lab|here]]. | |||
==Equipment== | ==Equipment== | ||
Revision as of 08:50, 24 October 2010
| <html><img src="/images/9/94/Report.png" border="0" /></html> Main project page <html><img src="/images/c/c3/Resultset_previous.png" border="0" /></html>Previous entry<html> </html>Next entry<html><img src="/images/5/5c/Resultset_next.png" border="0" /></html> | |
Electron DiffractionThe purpose of this experiment is three fold. The first part is to demonstrate the wave nature of electrons. To do this we passed electrons through a diffraction grating made of graphite at varying voltages and made notes on the resulting patterns on a fluorescent screen. From these patterns, we moved on to the second goal, measuring the de Broglie wavelength of the electrons. This wavelength is given by the relationship λ=h/p. Finally, we attempted to measure the spacing of the graphite from our data, and compare this with the known values for the spacings. Once again, I worked with Kirstin and her notebook page for this experiment is here. EquipmentThis experiment uses the following pieces of equipment:
Note Do not ever have a greater current than 0.25 mA, this will puncture the carbon sheets in the graphite and ruin the equipment. Set UpFollowing the diagram in Gold's manual, the one taped to the DC Power Supply, and the one on the experiments web page, here, we connected all of the wires on the set up as so:
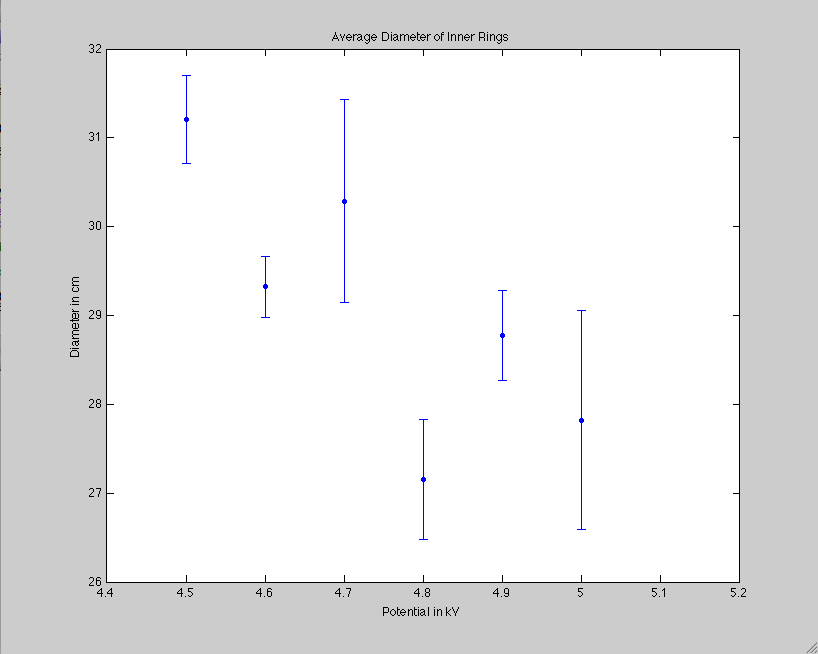
ProcedureAfter finishing our set up, we plugged in the power supplies and turned on the heater. We let the heater warm up for a couple of minutes as directed. We knew it was finished heating when a faint orange glow appeared at the base of the gun in the diffraction tube. At this point we carefully upped the potential on the power supply while keeping an eye on the current. By the time we reached the maximum potential of 5000 V, the current had only reached 0.1 mA, well below the safety threshold of .25 mA. At this high voltage, the florescent material started to glow. On the screen, a bright dot developed surrounded by two faint rings of light. The central dot was where the majority of the carbon was striking the fluorescent material, while the two faint rings where the local maxima in the diffraction pattern. By using the magnet attached to the collar, we were able to move the image around the screen. Initially we chose a position that was as close to the center of the screen as possible. we chose this so that there would be no error in our data from a change in length, but as mentioned below, this created difficulty in seeing the pattern. To take the data, we made two types of measurements for each set. For the first one, we measured to the left of the maximum, and then to the right of the maximum for the second. DataBrian P. Josey 13:33, 12 October 2010 (EDT) Double check your code to the data, to make sure these plots are correct. The labels look switched. Then if she's coming in on Wednesday, double check with Kirsten for the data itself. There could be a problem with the order on some of the data because of our back and forth data taking.
| |

