User:Casey M Culhane/Notebook/Biology 210 at AU
Header: Zebrafish 3/24/16
Purpose: The purpose of the lab was to analyze the affects of amoxicillin and metoprolol on the embryonic development of zebra fish. The main focus was on if the drugs altered the development of the fish by examining specific features of the zebra fish (ex. fin size, swim bladder, coloration, etc.) The test will show how antibiotics and beta-blocking drugs affect embryonic development.
Materials and Methods: A 24 well tray was obtained. Rows one and two were labeled A1-A8 and used for the control group. Rows three and four wells were labeled B1-B8 and used for the Amoxicillin experimental fish group. Rows five and six were labeled C1-C8 and used for the Metoprolol experimental fish group. 20 mL of Deerpark water was added into wells A1-A8. To make the amoxicillin solution, a tablet of 140 mg/mL amoxicillin was crushed using a mortar and pestle and dissolved into the Deerpark water. 20mL of the solution was added into wells B1-B8. To make the metoprolol solution, a tablet of 50 mg/mL of metoprolol was crushed using a mortar and pestle and dissolved into the Deerpark water. 20 mL of the solution was added into wells C1-C8. 1 zebrafish embryo was placed into each of the 24 wells. Over the next 14 days, the development of the fish were observed. On day 5, 5 mL of the water from each well was removed and 15 mL of either the Deerpark water or the treated solution was added to the respective wells. On day 5, all the egg shells were removed from the wells. The fish were fed each day once they hatched from their shells. Each day, the fish were placed under a microscope and examined.On days 7 and 14, a few fish were fixed. They were also examined. To fix each sample, a fish was added with very little water into a vile. A 0.02% tricaine solution was added to fill ¼ of the vile. 0.4% formaldehyde was added by fill 2/4 more of the vile. On day 14, the experiment ended, and the supplies were cleaned up.
Data and Observations:
Day 1: None of the fish had hatched from their embryos. All the water appeared undisturbed. Due to the weekend, observations for day 2 & 3 did not occur.
Day 4: The control fish and the amoxicillin fish were completely hatched and in the 48 hour development stage. Most of the metoprolol fish had hatched as well.
Day 5: Control fish had normal development except A7 & A8 which were deformed. The amoxicillin fish continued to follow normal development.
The metoprolol fish had normal development but did not respond to stimuli.
Day 6: Control fish had normal development except A8 was dead. The amoxicillin fish followed normal development. The metoprolol fish had normal
development but very slow motility.
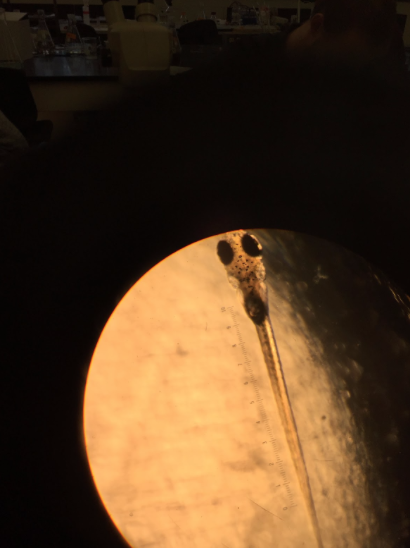
Day 7: Two fish from each experimental group was placed under the microscope. A2 was straight with normal swim bladder, fins, and heart rate.
A2 and A4 had steady heart rates. A2 appeared normal in other traits such as normal fins, normal swim bladder, and fast movements. A4
was slightly deformed with a bent tail, a bigger right fin, a bump on the front of it’s left side, twitchy, and an enlarged swim bladder. B1
and B3 were at similar stages of development. Both had straight bodies, slowed heart rates, slowed eye movement, normal swim bladders,
normal development, small fins, and no yolk sac. The only difference between B1 and B3 was that B1 was relatively non-motile, and B3
perked up when stimulated. C2 and C8 were also in very similar stages of development. Both had straight bodies, slowed heart rates,
small swim bladders, and a darkly tinted body. Both were very still. A6, B4, and C5 were fixed on day 7. A6 was measured to be 3,500 µm.
B4 was measured to be 3,125 µm. C5 was measured to be 3,000 µm. The following picture is of A2.
 The following picture is of A4.
 The following picture is of B1.
 No other images were obtained for Day 7. The fish were cared for on day 8; however, no observations were made. Days 9-10 the fish were
not observed or cared. Care and observations resumed on day 11.
Day 11: A2 was found dead and disintegration beginning. A5, A7, and A8 were dead, but disintegration had not yet begun. A1 was slightly curved,
motile, and deformed. A3 had a straight body with normal features such as heart beat, eye movement, fins, and coloration. A4 was very bent
and deformed. A4 still had a normal heart beat and eye movement. All of experimental group B was still alive and well developed. All eight amoxicillin
treated fish had common features such as normal heart rates and a straight body size. B6 seemed to be floating rather than swimming. All three fish
from metoprolol experimental group had a deformity of a slightly curved tail. C1 and C8 had slightly deformed swim bladders.
Day 12: The fish showed the same traits as they did on Day 11. The metoprolol treated fishes' tails had a more defined curvature.
Day 13: Only two fish in the control group, two fish in amoxicillin treated group, and one fish in metoprolol treated group were still alive. A3 was found dead.
A1 and A4 were deformed and unresponsive to stimuli. B1 and B3 had the most normal features with normal swim bladders. Neither was motile.
C1 had no movement in the eyes and a normal swim bladder, but the fish appeared to be floating. The table below describes each individual fish observed.
No other images were obtained for Day 7. The fish were cared for on day 8; however, no observations were made. Days 9-10 the fish were
not observed or cared. Care and observations resumed on day 11.
Day 11: A2 was found dead and disintegration beginning. A5, A7, and A8 were dead, but disintegration had not yet begun. A1 was slightly curved,
motile, and deformed. A3 had a straight body with normal features such as heart beat, eye movement, fins, and coloration. A4 was very bent
and deformed. A4 still had a normal heart beat and eye movement. All of experimental group B was still alive and well developed. All eight amoxicillin
treated fish had common features such as normal heart rates and a straight body size. B6 seemed to be floating rather than swimming. All three fish
from metoprolol experimental group had a deformity of a slightly curved tail. C1 and C8 had slightly deformed swim bladders.
Day 12: The fish showed the same traits as they did on Day 11. The metoprolol treated fishes' tails had a more defined curvature.
Day 13: Only two fish in the control group, two fish in amoxicillin treated group, and one fish in metoprolol treated group were still alive. A3 was found dead.
A1 and A4 were deformed and unresponsive to stimuli. B1 and B3 had the most normal features with normal swim bladders. Neither was motile.
C1 had no movement in the eyes and a normal swim bladder, but the fish appeared to be floating. The table below describes each individual fish observed.
 Day 14: All controls and metoprolol fish were officially dead. Thus, none were fixed. One amoxicillin fish (B3) was still alive. B3 was fixed and measured to be 3,575 µm.


Conclusions and Future Directions: The amoxicillin treated fish had the longest survival rate, whereas both the control and the metoprolol groups died off by day 14 of the experiment. The equal death of the control fish to the experimental groups indicates the main killer was an animal care problem. The developmental deformities of the metoprolol fish indicate the impact of the metoprolol on the fish. The quality of the data in the lab is fairly strong due to strict regulation; however, due to the low number in the sample size, further testing with more attentive animal care is needed. CC
Header: Vertebrate Analysis and Food Web 3/13/16
Purpose: The purpose of the lab was to analyze vertebrate animals that live in the transect.
Materials and Methods: After a trip to the transect, a list of possible vertebrate organisms was listed. No methods were performed directly on the organisms; rather, research was conducted to see organisms that are likely to live in a woodland brush habitat like transect 3.
Data and Observations: Although no vertebrate animal data was obtained for this lab, most likely vertebrates around the size of birds and squirrels use the transect to find food and shelter. Eastern gray squirrel (with the scientific name of Sciurus carolinensis), American robin (with the scientific name of Turdus migratorius), Eastern Garter Snake (with the scientific name of Thamnophis sirtalis sirtalis), Chipmunks (with the scientific name Tamias), and field mice (with the scientific name Mus musculus) were all found in the transect. A food web was constructed to show the flow of the microecosystem. The sun feeds the trees, grass, and plants. The trees, grass, and plants feed bugs, mammals (such as squirrels), and birds. All of those organisms then feed into decomposers in the soil. The decomposers feed back into the trees, plants, and grass. Figure 1 shown below is of the food web. 
Conclusions and Future Directions: This lab concludes the research on transect 3. The data concluded in this research project can be applied to living ecosystems of similar design. CC
Header: 16S Sequence Analysis 2/3/16
Purpose: The purpose of this lab is to isolate and analyze DNA from a bacteria in transect 3. Looking at the DNA of the bacteria will give a general idea of the different organisms that exist in the transect.
Materials and Methods: The hay infusion was prepared in lab three weeks before this lab. Two weeks ago, a hay infusion serial dilution was set up to make two sets of four agar plates (one normal and one with the antibiotic tet applied to it). We analyzed the plates by first looking at the colonies on each plate. We also set up the PCR for the 16s amplification by adding 20μL of primer/ water to 2 PCR tubes. After the PCR bead was dissolved, a small amount of a bacterial colony from the 10^-3 and the 10^-3 tet plates were each placed into a tube. The PCR tubes were placed in the PCR machine. In today's lab, Cassie injected the PCR into the gel electrophoresis. We turned off the lights to see the gels had not worked.
Data and Observations: None of the PCRs worked in our class. Therefore, the gel was blank. Likely, there was a malfunction in the primers used because other lab sections also found no results in their primers. Due to the lack data, we looked to the work of past students who worked with transect 3. The DNA data listed below is from last year's students. The first sequence is the 10^-3 Sequence. The website was unable to determine the bacterium associated with with the DNA. Since the bacterium was not identified, the colony morphology, gram stain, and motility was unable to be determined.
10^-3 Sequence: NNNNNNNNNNGNNGCNNNNNTGCAGTCGAACGGGGTANGCGTAANGCTGCTNCTAGAGGGGGAGAGGGGTGCGTGAGGGC NNAGCGTCTGACTGACCGCGGGAGAGGGGTTGAAANAGGAACGCTAAAACCATGAACGTCACAGAGGAAAAGGCGGGAGA CGGTGGCCTTTTGCTCTATTTAATGATNATGGGTGGGAGCCCGAGANGGTGGTGGTNNTCNCCGTAANGGNAAGATGTAT ATGGGGTCAGAGAANAAGCTNAGACNCAGAGAAACTGAGACAGCGTCCAGACTCATACGGGGGGNGGGTGTGGAATTTGG GGCAATGGGGGAAAGGGCCATATCCAGCCGTGCCGCGTGTGCGAAGAACGCCTGAGTTTTGCCCTGCTTTTTGTCTTGNG ATGAAGGCCAGGAATAAAATATTCTACNCTTGTGATTCTGACTGTACAAAAAGAATAAGGACCGGCTAACTCCGTGCCCG CAGCCGCGGTAATACGGAGGATGCTAGCGTTATTCAGATTTATTGGGTTTAACGCGTGCGTATGCGGTCTTTTAATTCAA TGGTCAAATACTCTACCTCAACTGTCGCATTGCCTTTGATACTGTAGTACTTGAGTCTGTTTGANGTGNGTGCAATTACA CGTGTAACGGTGATATNCATANATATGTCNNGGANCTCCNATTGCGNNNGCCTCTCCCTANNCTNNCACTGACGCTNATG CACGAANGNNNNNGGATCGAACAGGATTACATACNCTCNNNNNCCACNCCCTANACAATTATAACTTGATGTTTGNNAAG ACAAAANNCTNCCCNCCCNCCCCAANCNTTTNNTTNNTNNNCCTNNGGAGGAGGNNCNCCCNGGTGAANACTCNNNNGNN TTTNNNNNCNGNCNNCACNCNCNCANNANNNGNNNNNNNNNNNNNNTNATACNNNAANNAACCNTGCNNCCCCTCCTTNN NNNNNGGGGGNNGNGGANAANNANNNNNNNNNNGNTNNNNNNNNNNANGANGNAANNNNNNNNNGGNGGGGNNNNNNNNN NNNNNNNTNTTNNTANNNNNANNNGGNGNNNNNANCNNCNNNNNGTNNNNN
The second sequence is the 10^-3 tet sequence. The website identified this DNA sequence to be a variovorex paradoxus. It stated the bacteria was gram negative, so the gram negative implication is applied to the 10^-3 tet sequence. The bacteria is motile and also clumps into yellow colonies. The agar plates from our lab support these findings as yellow colonies were found.
10^-3 tet Sequence: NNNNNNNNNCNTANNNTGCAGTCGTANCAANGTAGCCNNNNNNTCCTGGCGGCGAGTGGCGAACGGGTGAGTAATACATC GGAACGTGCCCAATCGTGGGGGATAACGCAGCGAAAGCTGTGCTAATACCGCATACGATCTACGGATGAAAGCAGGGGAT CGCAAGACCTTGCGCGAATGGAGCGGCCGATGGCAGATTAGGTAGTTGGTGAGGTAAAGGCTCACCAAGCCTTCGATCTG TAGCTGGTCTGAGAGGACGACCAGCCACACTGGGACTGAGACACGGCCCAAACTCCTACGGGAGGCAGCAGTGGGGAATT TTGGACAATGGGCGAAAGCCTGATCCAGCCATGCCGCGTGCAGGATGAAGGCCTTCGGGTTGTAAACTGCTTTTGTACGG AACGAAACGGCCTTTTCTAATAAAGAGGGCTAATGACGGTACCGTAAGAATAAGCACCGGCTAACTACGTGCCAGCAGCC GCGGTAATACGTAGGGTGCAAGCGTTAATCGGAATTACTGGGCGTAAAGCGTGCGCAGGCGGTTATGTAAGACAGTTGTG AAATCCCCGGGCTCAACCTGGGAACTGCATCTGTGACTGCATAGCTAGAGTACGGTAGAGGGGGATGGAATTCCGCGTGT AGCAGTGAAATGCGTAGATATGCGGAGGAACACCGATGGCGAAGGCAATCCCCTGGACCTGTACTGACGCTCATGCACGA AAGCGTGGGGAGCAAACAGGATTAGATACCCTGGTAGTCCACGCCCTAAACGATGTCAACTGGTTGTTGGGTCTTCACTG ACTCANTAACNAAGCTAACGCGTGAAGTTGACCGCCTGGGGAGTACGGCCGCAAGGTTGAAACTCAAGGAATTGACGGGG ACCCGCACNAACGGTGGATGATGTGGTTTAATTCNATGCAACNCNAAAAACCTTACCCACCTTTGACATGTACGGAATTC NNCAGANNTNGCTTANGGCTCNAANNANAACCGTTACACNGNTGCTGCATGGNNGTCNTCAGCTCGTGTCNNGAGNNNNT NGGGNTAANTCCCGNAACNAGCNCNNACCCNNTGNNN
Conclusions and Future Directions: In the future, the PCR should be rerun with new primers to retest the DNA. Hopefully with the development of DNA data, the website will be more conclusive on the type of bacteria found. CC
Header: Invertebrates and Vertebrates2/10/16
Purpose: The purpose of this lab was to use a dichotomous key to identify invertebrates in the transect from the Berlese Funnel. By identifying the creatures, the mechanisms of motility were also examined.
Materials and Methods: This lab had three parts. The first focused on observing acoelomate Planaria, nematodes, and coelomate Annelida with a dissecting scope. A cross section of the nematodes was also prepared and placed under the scope. The second part of the lab was based around arthropods. An organism from each of the five major classes of arthropods (arachnida, diplopoda, chilopoda, insect, and crustacea) were examined under a microscope and classified. The third part involved the Berlese Funnel. The Berlese Funnel was set up last week. A Berlese Funnel was set up by pouring 25 mL of 50:50 ethanol/water solution into the 50 mL conical tube. A piece of screening material was fitted to the bottom of the funnel and the sides of the screen were taped on so left litter does not fall out. Leaf litter from the transect was then added into the funnel. The funnel was placed on a ring stand that was underneath a 40 watt lamb with parafilm around the base of the funnel. All the funnels from the lab class were placed under the same lamp. Aluminum foil was wrapped around all the funnels. The funnels were left for a week. During today's lab, the Funnel was broken down by pouring out the top 10-15 mL of 50% ethanol and organisms into a petri dish. Not all the liquid fit into one dish. The rest of the liquid went onto the second petri dish. Both dishes were placed under a dissecting microscope. A dichotomous key was obtained. Organisms from the petri dish were identified.
Data and Observations: Although the procedure stated to identify at least five invertebrates, only three invertebrates were found from the Berlese Funnel collections. The following picture lists the three organisms found.  The first organism found was from the first petri dish (the first petri dish came from the top of the Funnel collections). The organisms was a termite from the major class of Insects. It was 40 ocular spaces long. Since the organism was found under a dissecting microscope with no conversion rate to mm, the length was left in ocular spaces. There were two termites in the petri dish. The termite was long with a hard shell, small legs, and an antenna. The second organism was an ant from the major class of insects. It was 1300 μm long. There was only one in the sample. On top of being long, with a hard shell, and an antenna, the ant also had a wing. The ant was found in the petri dish from the top of Berlese Funnel. The last organism was a phylum annelida. It was 2000 μm long, and there were three in the sample. It was long, skinny, compartmentalized, and had no exoskeleton. There were no living organisms in the second petri dish which held liquid from the bottom of the Funnel. Instead, the second petri dish had a lot of dirt particles.
Results: The different organisms found indicated there is an abundance of life in transect 3. The Berelese Funnel was successful. CC
Header: Analyzing Plantae and Fungi 2/3/16
Purpose: The purpose of this lab is to explain the difference between fungi and plants. The lab also focuses on the differences between angiosperms and bryophytes. By looking at angiosperms and bryophytes, the structure and function of the reproductive parts of a flower are also highlighted. The plants and fungi will most likely differ in their cellular structures which will force differences between the special cells and vascularization.
Materials and Methods: Before starting the lab, 5 plant samples were obtained from the transect. To prepare for looking at the plants from the transect, examples of of moss and lilies were examined under a dissecting microscope. Then one at a time, place each of the 5 plant samples into the microscope and examine the vascularization of the plants. Hight must be recorded and a cross section of each plant should be observed. Next, re-examine the leaves of the moss to check for specialized structures. When looking at the moss Polatrichum, identify the male and female gametophytes and sporophytes. After analyzing the moss, dissect the lily to identify the anther, pollen, stigma, and the style of the flower. Then the lab seeds and seeds from the transect to identify the parts of the seeds. The final part of the lab is to set up for the lab next week. A Berlese Funnel was set up by pouring 25 mL of 50:50 ethanol/water solution into the 50 mL conical tube. A piece of screening material was fitted to the bottom of the funnel and the sides of the screen were taped on so left litter does not fall out. Leaf litter from the transect was then added into the funnel. The funnel was placed on a ring stand that was underneath a 40 watt lamb with parafilm around the base of the funnel. The Berlese Funnel was left until next lab period.
Data and Observations: The following picture is Table 1 from page 52. The table characterizes the plants collected from the transect.  The locations for the plants are listed relative to the aerial diagram. The plants are found throughout the transect. Two plants are found in the top right of the transect. One plant is found in the center of the back. One is found in the front middle, and the fifth plant is found in the dead center of the aerial diagram. The first leaf was flat, yellow, and long. The following picture is of plant 1.
  The second leaf was large, green, and arrow shaped. It is found on a big tree in the transect. The following picture is of the second leaf.
  The third leaf is dark brown and dead looking. It is found on a low lying bush in the transect. The following picture is of the third leaf.
  The fourth leaf is a medium shade of green and are prickly. The leaves are found on a medium sided prickly bush. The following picture is of the fourth leaf.
  The fifth leaf is dark green and attached to a predominant branch. The leaves are found on a medium sized bush. The following picture is of the fifth leaf.
  Although the protocol called for seeds from the transect to be collected and analyzed, no seeds were found in the transect because of the season. Fungi sporangia are important because it releases spores. The spores will then land and grow into a new fungi. The fungus analyzed in the lab was a mushroom. It is a basidiomycota because it is a terrestrial fungi and it is a mushroom. The following picture is a sketch of the mushroom under the dissecting microscope.
Conclusions and Future Directions: The lab displayed how to distinguish fungi from plants with their structural layouts. The varying plants from the transect showed the structures of the plants; however, seeds were not able to be analyzed. If the lab were performed during the spring, seeds could be collected and analyzed. CC
Header: Observing Microorganisms 1/27/16
Purpose: The purpose of this lab is to compare microorganism growth in an antibiotic resistant environment. The lab will show that in the microorganisms' growth will flourish on a normal agar plate; however, the microorganisms' growth will be significantly stunted by the antibiotic resistant agar plate. This is important because reactions by microorganisms to antibiotic resistant environments is the basis of medication and treatment of certain diseases.
Materials and Methods: This lab has three procedures. The first procedure included analyzing the agar plates. The agar plates were obtained and examined at the macroscopic level. The number of colonies on each plate were counted and recorded in Table 1. The second procedure involved a patch of growth from the top of the two agar plates (one that just has the nutrient and one that has both the nutrient and the tet). Each was placed on a slide and gram stained. To prepare a stained slide, one had to sterilize a metal loop using a fire. The loop then was used to obtain a small patch of growth. A drop of water was placed on the slide. The slide was passed through the fire and then crystal violet was added to the patch for 1 minute. At 1 minute, the crystal violet was washed off, rinsed with water, and covered again with Gram's iodine mordant for another minute. Again, the patch was rinsed with water, decolorized with 95% alcohol for 10-20 seconds. The safranin stain was placed on the patch for 20-30 seconds, and then the patch was rinsed with water. Finally, excess water was blotted off the slide, and the slide was placed under a microscope. Descriptions of the microorganisms in the slides were recorded in Tables 2 and 3. The final procedure for the lab was to set up a PCR for 16s amplification. After labeling the 2 PCR tubes with transect number, colony identifier, and group number, 20 μL of the primer mixture was added to the PCR tubes and mixed to dissolve the PCR bead. Each of the two bacterial colonies were added into the tube using a toothpick, and the tube was closed and placed in the PCR machine. The machine will run for several hours, and the PCR data will be analyzed next week in lab.
Data and Observations: The following photos are pictures of the nutrient agar plates and the nutrient + tet agar plates. The plates show the growth of the colonies. 
 The number of colonies on each of the eight agar plates was recorded into Table 1. Table 1 is the following picture.
  . Clearly, the number of colonies of microorganisms were larger on the plain nutrient plates. For example, the 10^3 dilution nutrient agar had 406000 colonies, whereas the nutrient + get agar plate at the same dilution had 113000. The trend carries through all the dilution levels. This indicates that the microorganisms grow better without the antibiotic present. The lack of antibiotic allows the microorganisms to grow and reproduce without any competitors. The antibiotic resistant agar plates have significantly less colonies because the antibiotic resistant agar kills the microorganisms. The exact number of bacteria and fungi that were effected by the tetracycline were not recorded during the lab. Also, the specific species of bacteria that were affected by the tetracycline were not recorded in the lab. The following tables 2 and 3 show descriptions of the cells and motility types of the colonies.
  Figures 1 through 4 are displayed in Table 3.
  . No pictures of the organisms were able to be obtained through the microscopes.
Conclusions and Future Directions: The agar plates showed abundant life on the nutrient plates compared to the growth on the nutrient + tet plates. The hypothesis is supported through the evidence presented in Table 1. Table 1 shows the large amount of colonies grown in the nutrient plates, whereas there is significantly less colonies on the nutrient + tet plates. The tetracycline kills off the microorganisms. CC
Header: Analyzing the Hay Infusion for Organisms 1/20/16
Purpose: The purpose of studying the hay infusion that was set up last week is to see what organisms grew in the infusion. The infusion will grow life; however, the life will not be particularly abundant. The life will only be visible using a microscope.
Materials and Methods: The lab today has three parts. The first part is to use a dichotomous key. One must start by mounting wet slides of a variety of known organisms (for example, haematococcus, tolypothrire, marine diatoms, conceptacle of fucus (male and female), and euglena). The microscopes should be set at either the 4x or the 10x objective. Once the microscope is focused, the organisms should be measured using an ocular micrometer. The organisms should be compared to a dichotomous key to guess the identity of the organisms and then checked against diagrams of organisms. The second part of the lab is to apply knowledge of the organisms to the hay infusions. After photographing the hay infusion, noting the smell, and recording notes about the appearance of the infusion, one should take a sample from the top of the infusion and the bottom of the infusion. The top and the bottom should be mounted onto wet slides and focused on the microscope between 4x and 10x. Then one should identify 3 organisms from both the top of the infusion slide and the bottom of the infusion slide. The organisms should be measured using the ocular micrometer and descriptions of the organisms should be noted. The final part of the lab is to set up a serial dilution. Four tubes are needed. Each tube contains 10mLs of sterile broth containing one of the following: 10^-2, 10^-4, 10^-6, or 10^-8. Four nutrient agar and four nutrient agar plus tetracycline plates are also needed. After labeling the plates, add 100 microliters of the culture to the 10mLs of broth in the 10^-2 tube. The mixture should be stirred. 100 micrometers of the 10^-2 broth is then added a tube holding 10^-4. The mixture should be stirred well. The procedure should be completed similar for the 10^-6 and 10^-8 tubes. Finally, put 100 microliters from the 10^-2 tube onto the nutrient agar plate labeled 10^-3. Spread the sample on the plate using cooled glass. Then place 100 microliters from the 10^-2 tube onto the 10^-3 + tet plate. Spread the sample on the plate using cooled glass. Both procedures should be repeated for the 10^-4 dilution (which is placed onto the 10^-5 plate), the 10^-6 dilution (which is placed onto the 10^-7 plate), and the 10^-8 dilution (which is placed onto the 10^-9 plate). The plates should held at room temperature room for a week.
Data and Observations: The following photo are drawings from organisms that were identified using a dichotomous key.  The hay infusion's smell was not very strong. The smell was similar to wet dirt. The liquid in the hay infusion was darkly tinted but not difficult to see through. There was lots of big straw sticking out of the infusion. There was a film of mold on the top of the infusion. Nothing was moving but there was a likelihood of life inside the infusion. The following photos are pictures of the hay infusion.


 The two niches examined from the hay infusion was the top and the bottom of the infusions. There is plant matter in both niches; however, the plant matter is more prominent in the top of the infusion. Three organisms found from the top of the hay infusion are peranema (100μM), arcella (90μM), and oedogonium (70μM). The peranema are mobile but do not perform photosynthesis, so therefore they are protozoa.The peranema meets all the requirements of life by taking in energy in the form of capturing yeast or other bacteria. The organisms are unicellular creatures who replicate using binary fission, and they evolve into other more complex forms of bacteria. Finally, the peranema takes in information from its environment using sensors. The arcella are not mobile and do not perform photosynthesis, so therefore they are also protozoa. The oedogonium are not mobile and do not perform photosynthesis, so they are an algae. The following pictures are from the top of the hay infusion and include the protists identified as described above.

From the bottom of the infusion, colpidium (50 μM) and oedogonium (70 μM) were found. The colpidium were motile but did not perform photosynthesis, so therefore the are a protozoa. The oedogonium were non-motile but did perform photosynthesis. If the hay infusion grew for another two months, more complex organisms would be present; however, due to the constraints of the community, the organisms would not advance to be multicellular. The following picture is from the bottom of the hay infusion and includes the protists identified and described above. 
The final part of the lab was to set up a serial dilution. The following photo is a diagram of the serial dilution performed in lab. 
Conclusions and Future Directions: The hay infusion showed life. The life was not apparent just by looking at the infusion; however, the microscope slides showed a diversity of algae and protozoa from the top and bottom niches of the infusion. The hypothesis is supported because a microscope was needed to see the life from the infusion. CC
Header: Viewing the Volvocine Line and a Transect at AU 1/13/16
Purpose: The purpose of studying the Volvocine Line is to analyze the evolution of one line of organisms. The purpose of studying the transect at AU is to see the biotic and abiotic factors of an ecosystem. The chlamydomonas will be the most evolved in the Volvocine Line with gonium as the second most evolved and volvox as the least evolved. The transect at AU will be contain more biotic factors than abiotic factors.
Materials and Methods: To view the chlamydomonas, one must mount a wet slide with the chlamydomonas and place the slide under the microscope. After adjusting the lens to 40x, one can count the number of cells, measure colony size, determine the presence of specialized cells, determine the mechanism of motility, determine if it is isogamous or oogamous, and draw a picture of the organism. After analyzing the chlamydomonas, take the wet slide off the microscope. Then, one should prepare slides for the gonium and volvox and repeat the procedures. To view the transect, one must walk to his or her transect location. At the location, one should draw the transect, explain the components of the transect, and collect a sample of materials from the transect. The collection of materials will be used to make a hay infusion. Back in the lab, 12 grams of the collected materials from the transect will be added to a plastic jar. 500 mLs of water from deer park will be added as well. Then 0.1 gram of died milk will be put into the jar. The jar will be mixed by shaking for 10 seconds. The jar is left without a lid on the jar for a week.
Data and Observations: The following are pictures from the transect. 


 The following photo is an aerial diagram of the transect.
  The following are biotic factors located in the transect: low brush, medium sized trees, big trees, bushes, and bugs. The following are abiotic factors located in the transect: concrete (sidewalk), light pole, cigarette bud, rock, and plastic layers under the dirt. The transect is on a slight hill and is located in between Bender gym and Hughes Hall. There are two benches located in the transect. There are two light poles located in the transect. The concrete circles the low and medium sized brush/ trees. Cigarette buds are scattered along the concrete sidewalks of the transect. Although the bugs are not typically seen, there are organisms living in the soil and brush. Underneath the dirt of the transect is a plastic sheet.
The following is a picture of Table 1. Table 1 shows the evolutionary specialization of the volvocine line.
The following are biotic factors located in the transect: low brush, medium sized trees, big trees, bushes, and bugs. The following are abiotic factors located in the transect: concrete (sidewalk), light pole, cigarette bud, rock, and plastic layers under the dirt. The transect is on a slight hill and is located in between Bender gym and Hughes Hall. There are two benches located in the transect. There are two light poles located in the transect. The concrete circles the low and medium sized brush/ trees. Cigarette buds are scattered along the concrete sidewalks of the transect. Although the bugs are not typically seen, there are organisms living in the soil and brush. Underneath the dirt of the transect is a plastic sheet.
The following is a picture of Table 1. Table 1 shows the evolutionary specialization of the volvocine line. 
Conclusions and Future Directions: The data proves the chlamydomonas to be the least evolved, the gonium to be the second most evolved, and the volvox to be the most evaluated. The hypothesis is rejected except for the part that marks the gonium as the second most evolved. The transect at AU did contain more biotic factors than abiotic factors, so the hypothesis is supported. CC