User:Catherine Koenigsknecht/Notebook/Experimental Biological Chemistry/2013/02/06: Difference between revisions
From OpenWetWare
Jump to navigationJump to search
(→Data) |
(→Notes) |
||
| (One intermediate revision by the same user not shown) | |||
| Line 92: | Line 92: | ||
==Notes== | ==Notes== | ||
Concentration recalculations were taken from Dhea Patel | |||
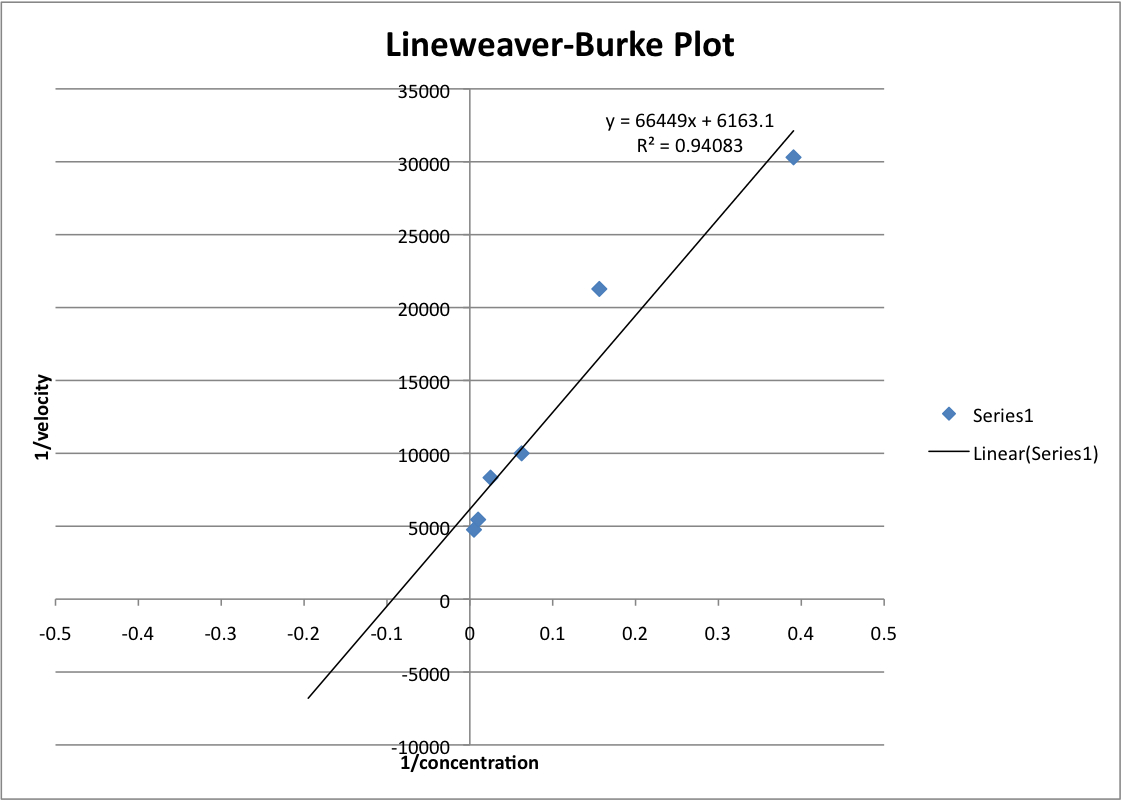
Deleted concentration 2.56 uM point from graphs | |||
Use categories like tags. Change the "Course" category to the one corresponding to your course. The "Miscellaneous" tag can be used for particular experiments, as instructed by your professor. Please be sure to change or delete this tag as required so that the categories remain well organized. | Use categories like tags. Change the "Course" category to the one corresponding to your course. The "Miscellaneous" tag can be used for particular experiments, as instructed by your professor. Please be sure to change or delete this tag as required so that the categories remain well organized. | ||
Revision as of 09:59, 12 February 2013
 Biomaterials Design Lab Biomaterials Design Lab
|
<html><img src="/images/9/94/Report.png" border="0" /></html> Main project page <html><img src="/images/c/c3/Resultset_previous.png" border="0" /></html>Previous entry<html> </html>Next entry<html><img src="/images/5/5c/Resultset_next.png" border="0" /></html> | ||||||||||||||||||||||||||||||||||||
Entry titleObjectiveLearn how to maintain an OpenWetWare Notebook. Description
Data
NotesConcentration recalculations were taken from Dhea Patel Deleted concentration 2.56 uM point from graphs Use categories like tags. Change the "Course" category to the one corresponding to your course. The "Miscellaneous" tag can be used for particular experiments, as instructed by your professor. Please be sure to change or delete this tag as required so that the categories remain well organized.
| |||||||||||||||||||||||||||||||||||||


