User:Catherine Koenigsknecht/Notebook/Experimental Biological Chemistry/2013/02/13: Difference between revisions

From OpenWetWare
Jump to navigationJump to search
Line 69: Line 69:


==Notes==
==Notes==
* For run #2 concentration 6.4 uM was removed as an outlier
* For run #2 concentration 40 uM was removed as an outlier
* For run #1 no values for concentration 150 uM were used
* Ki values for the inhibitors were found in a paper from Planta Medica:
{| {{table}}
| align="center" style="background:#f0f0f0;"|'''Flavanoid'''
| align="center" style="background:#f0f0f0;"|'''Ki value)'''
|-
| Myricetin||32 uM
|-
| Kaempferol||32 uM
|-
| Quericetin||26 uM
|}


Revision as of 11:20, 15 February 2013

Biomaterials Design Lab <html><img src="/images/9/94/Report.png" border="0" /></html> Main project page
<html><img src="/images/c/c3/Resultset_previous.png" border="0" /></html>Previous entry<html>&nbsp;&nbsp;&nbsp;&nbsp;&nbsp;&nbsp;</html>Next entry<html><img src="/images/5/5c/Resultset_next.png" border="0" /></html>

Entry title

Objective

Use data collected yesterday to calculate Average values of the Assay and calculate Km

Description

  • Calculations using all three assays were performed:
  1. Velocity by Concentration was graphed for each run
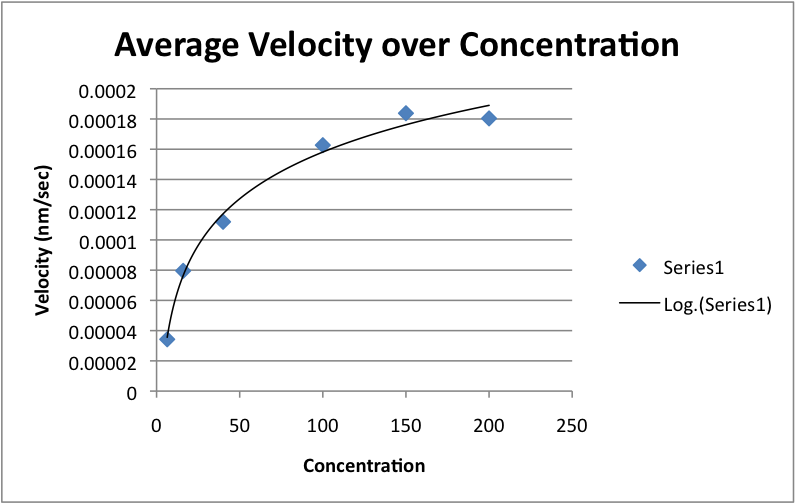
  2. An average velocity of all three runs was graphed by concentration
  3. A Lineweaver-Burke Plot was graphed for each run and Km was calculated
  4. A Lineweaver-Burke Plot was graphed for the average of the three runs and an average Km was calculated
  5. Error bars were added to the average Lineweaver-Burke Plot by calculating the standard deviation of the three runs 1/velocity values
  • Dhea and Mary's first assay data was added to Mike and mine assays to produce an average for four runs
  1. An Average velocity of combine data was graphed by concentration
  2. A Lineweaver-Burke Plot was graphed for the average of the combined data and an average Km was calculated
  3. Error bars were added to the combined data average Lineweaver-Burke plot by calculating the standard deviation of the combined data 1/velocity values

Data

  • All Graphs and Tables are for the Combined Data:
Final Concentration Adenosine (uM) Average velocity over 180 seconds (nm/sec) 1/[Adenosine] (1/uM) 1/average velocity (sec/nm)
200 0.000180385 0.005 5543.691027
150 0.000183794 0.006666667 5440.881764
100 0.000162678 0.01 6147.11077
40 0.000111981 0.025 8930.093256
16 7.95434E-05 0.0625 12571.75005
6.4 3.42451E-05 0.15625 29201.27683


  • Km calculations
Equation Value calculated
(-1)/Km 0.028053516
Km 35.64615572
1/Vmax 4440.372695
Vmax 0.000225206

Notes

  • For run #2 concentration 40 uM was removed as an outlier
  • For run #1 no values for concentration 150 uM were used
  • Ki values for the inhibitors were found in a paper from Planta Medica:
Flavanoid Ki value)
Myricetin 32 uM
Kaempferol 32 uM
Quericetin 26 uM


Use categories like tags. Change the "Course" category to the one corresponding to your course. The "Miscellaneous" tag can be used for particular experiments, as instructed by your professor. Please be sure to change or delete this tag as required so that the categories remain well organized.