User:Darrell Bonn/Notebook/307L Lab book/lab 6 Balmer: Difference between revisions
Darrell Bonn (talk | contribs) (New page: {|{{table}} width="800" |- |style="background-color: #EEE"|128px<span style="font-size:22px;"> Project name</span> |style="background-color: #F2F2F2" align="...) |
(No difference)
|
Revision as of 15:39, 22 September 2008
| <html><img src="/images/9/94/Report.png" border="0" /></html> Main project page | |
Balmer SeriesIt is our aim to successfully calibrate a constant deviation spectrometer with known values of the mercury spectrum and proceed to measure the spectra of hydrogen and deuterium. We will use these values to determine the Rydberg constant. Then we will use the same apparatus aimed at a sodium lamp in order to attempt to resolve the two characteristic closely spaced lines of its spectrum. ProcedureThe procedure can be found in Dr. Gould's manual CalibrationBefore calibration begins we notice that the prism looks a little dusty and has white impurity on its backside. We are afraid that cleaning it might result in a change in its surface optical properties so we try to calibrate with the prism as is (If we can not isolate a spectral line adequately we will try to clean it).
MeasurementsBefore each set of measurements (for each element) we recalibrate the spectrometer to a different color so as to minimize the systematic error of our vernier scale accuracy. For all of these measurements we determine that, due to the physical limitations of the vernier scale, we can not be sure of their certainty to within +/-1nm. To minimize variations, all readings are taken after moving the dial in the clockwise direction. Clockwise was chosen as it is pushing against the spring. Darrell had previous experience with this type of instrument and knew that moving into the spring would provide more consistent measurements.
-Accepted Values of Hydrogen Spectra
-Measured Values of Hydrogen Spectra 1st Run (calibrated to violet1)
2nd Run (calibrated to violet2)
3rd Run (calibrated to green/blue): For this run Darrell narrowed the slit to obtain higher resolution lines.
4th Run (calibrated to Red)
Now we'll get some data with the same calibration to compare our repeatability in reading 4th Run (Repeat of calibrated to Red)
4th Run (Repeat of calibrated to Red)
Keeping the final calibration used for hydrogen as it produced decent results compared to known spectra and decent repeatability 1st Run
2nd Run
3rd Run
4th Run
5th Run
We are instructed by the manual to see if we can succesfully measure the two closely spaced yellow lines (586.0 & 586.6) characteristic of the sodium spectrum. Unfurtunately we were unable to find a sodium lamp so we decided to find another element whose sapectrum contains two closely spaced lines. After searching for spectra on the internet we saw that Krypton has fairly closely spaced lines so we decided to use this gas for our measurement of the resolution. Within the purple region of the spectrum we found quite a few closely spaced lines. So we looked for 2 that were as close together as we could resolve. These lines were at 445.4nm and 445nm, indicating that we have a resolution well within 1nm. Repeating this procedure in the orange part of the spectrum we found two lines that were equally closely spaced together as the two purple lines, however they were at 605nm and 607nm, indicating to us that the resolution of our spectrometer at longer wavelengths was lower. We thought to look for this difference in resolution because of the change in the scale of the vernier dial indicated that it would have a sensitivity that changed across the range of measurements. This also fits well with our understanding of the dispersion of light that the instrument depends on. The angle of difraction, as a function of wavelength, does not follow a straigt line but is curved. (see dispersion of light)
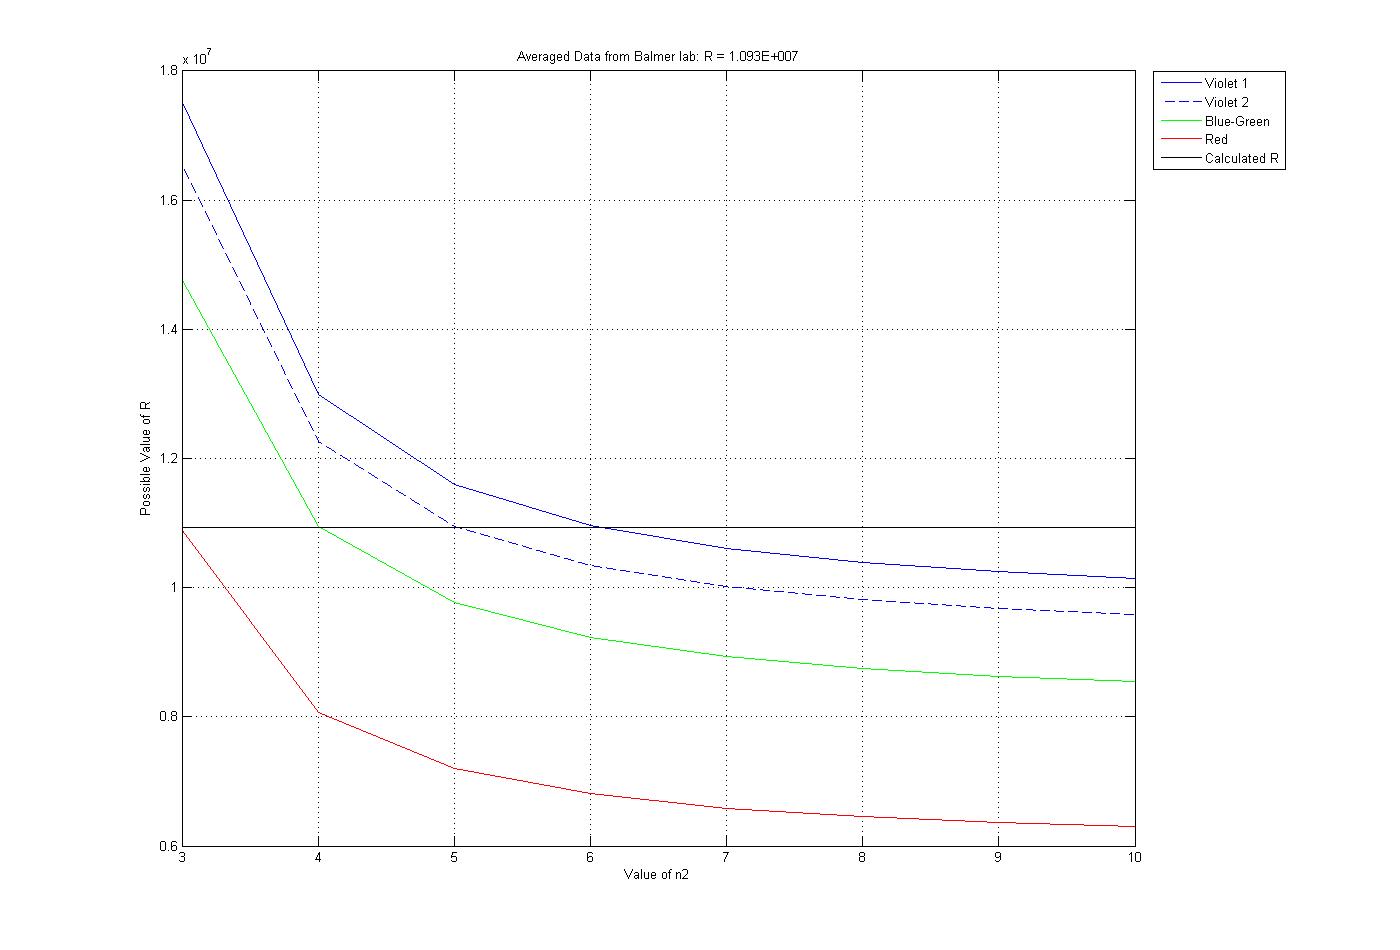
Using matlab we calculated possible values for R with a variety of values for n2 for each frequency. Looking through these we found the closest to constant value and used this for Rydberg. The plot of the data produced by the code is below. matlab code |
|
