User:Elaine Marie Robbins/Notebook/CHEM-496/2011/08/31: Difference between revisions
No edit summary |
|||
| (6 intermediate revisions by the same user not shown) | |||
| Line 1: | Line 1: | ||
{|{{table}} width="800" | {|{{table}} width="800" | ||
|- | |- | ||
|style="background-color: #EEE"|[[Image:BDLlogo_notext_lr.png|128px]]<span style="font-size:22px;"> | |style="background-color: #EEE"|[[Image:BDLlogo_notext_lr.png|128px]]<span style="font-size:22px;"> Synthesizing Gold Nanoparticles</span> | ||
|style="background-color: #F2F2F2" align="center"|<html><img src="/images/9/94/Report.png" border="0" /></html> [[{{#sub:{{FULLPAGENAME}}|0|-11}}|Main project page]]<br />{{#if:{{#lnpreventry:{{FULLPAGENAME}}}}|<html><img src="/images/c/c3/Resultset_previous.png" border="0" /></html>[[{{#lnpreventry:{{FULLPAGENAME}}}}{{!}}Previous entry]]<html> </html>}}{{#if:{{#lnnextentry:{{FULLPAGENAME}}}}|[[{{#lnnextentry:{{FULLPAGENAME}}}}{{!}}Next entry]]<html><img src="/images/5/5c/Resultset_next.png" border="0" /></html>}} | |style="background-color: #F2F2F2" align="center"|<html><img src="/images/9/94/Report.png" border="0" /></html> [[{{#sub:{{FULLPAGENAME}}|0|-11}}|Main project page]]<br />{{#if:{{#lnpreventry:{{FULLPAGENAME}}}}|<html><img src="/images/c/c3/Resultset_previous.png" border="0" /></html>[[{{#lnpreventry:{{FULLPAGENAME}}}}{{!}}Previous entry]]<html> </html>}}{{#if:{{#lnnextentry:{{FULLPAGENAME}}}}|[[{{#lnnextentry:{{FULLPAGENAME}}}}{{!}}Next entry]]<html><img src="/images/5/5c/Resultset_next.png" border="0" /></html>}} | ||
|- | |- | ||
| Line 7: | Line 7: | ||
<!-- ##### DO NOT edit above this line unless you know what you are doing. ##### --> | <!-- ##### DO NOT edit above this line unless you know what you are doing. ##### --> | ||
==Objective== | ==Objective== | ||
To determine how pH affects the synthesis of gold nanoparticles ( | To determine how pH affects the synthesis of gold nanoparticles (AuNP) using the procedure developed here: | ||
| Line 25: | Line 21: | ||
# Combine 10 mL of 50 mM acetate buffer (pH 5.46) with 1.1×10<sup>-3</sup> g of .0015 mM bovine serum albumin (BSA) and 4.0×10<sup>-4</sup> g of 0.25 mM chloroauric acid (HAuCl<sub>4</sub>) in a capped test tube at room temperature. | # Combine 10 mL of 50 mM acetate buffer (pH 5.46) with 1.1×10<sup>-3</sup> g of .0015 mM bovine serum albumin (BSA) and 4.0×10<sup>-4</sup> g of 0.25 mM chloroauric acid (HAuCl<sub>4</sub>) in a capped test tube at room temperature. | ||
# Use a small amount of distilled water to aid in transferring measured quantities to capped test tube. | # Use a small amount of distilled water to aid in transferring measured quantities to capped test tube. | ||
# Take UV vis spectra (200 nm to 800 nm) of buffer and reaction mixture. | # Take UV-vis spectra (200 nm to 800 nm) at room temperature of a sample of buffer and reaction mixture. | ||
# Place reaction mixture in an oven at 80°C for | # Place reaction mixture in an oven at 80°C for 2.5 hr under thermostatic conditions. | ||
# Continue to take UV vis spectra of reaction mixture every 30 minutes. | # Continue to take UV-vis spectra of reaction mixture at room temperature every 30 minutes. | ||
# After 2.5 hr, remove from oven and cool to room temperature; leave sitting overnight. | # After 2.5 hr, remove from oven and cool to room temperature; leave sitting overnight. | ||
| Line 49: | Line 45: | ||
'''Results:''' | '''Results:''' | ||
The absorbance values for the acetate buffer were subtracted from absorbance values for the reaction mixture recorded by the UV- | The absorbance values for the acetate buffer were subtracted from absorbance values for the reaction mixture recorded by the UV-vis to find a corrected absorbance value that would indicate the absorbance of the AuNP and the BSA only. | ||
The corrected absorbance values at 550 nm (The wavelength that Au NP should absorb) were graphed against time. The graph (below) shows that some | The corrected absorbance values at 550 nm (The wavelength that Au NP should absorb) were graphed against time. The graph (below) shows that some AuNP were created, as absorbance values do increase. However, it is possible some were destroyed as the absorbance rates do drop slightly starting at 120 min into the procedure. | ||
<center>[[Image:Absorbance vs time.jpg|600px]]</center> | <center>[[Image:Absorbance vs time 8-31-11.jpg|600px]]</center> | ||
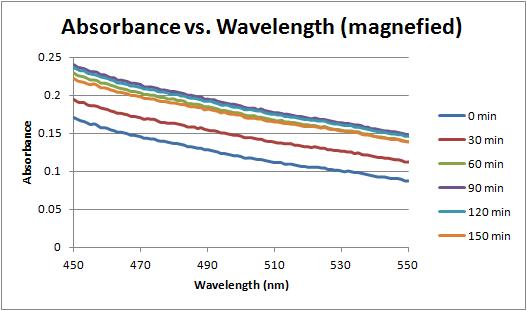
In addition, a second graph showing corrected absorbance against wavelength was created, to shed light on which time the | In addition, a second graph showing corrected absorbance against wavelength was created, to shed light on which time the AuNP began to form. | ||
<center>[[Image:Absorbance vs wavelength.jpg|600px]]</center> | <center>[[Image:Absorbance vs wavelength 8-31-11.jpg|600px]]</center> | ||
| Line 66: | Line 62: | ||
<center>[[Image:Absorbance vs wavelength | <center>[[Image:Absorbance vs wavelength magnified 8-31-11.jpg|600px]]</center> | ||
==Notes== | ==Notes== | ||
| Line 74: | Line 70: | ||
[[Category:Course]] | [[Category:Course]] | ||
[[Category:Miscellaneous]] | [[Category:Miscellaneous]] | ||
Revision as of 09:49, 19 October 2011
 Synthesizing Gold Nanoparticles Synthesizing Gold Nanoparticles
|
<html><img src="/images/9/94/Report.png" border="0" /></html> Main project page Next entry<html><img src="/images/5/5c/Resultset_next.png" border="0" /></html> |
|
ObjectiveTo determine how pH affects the synthesis of gold nanoparticles (AuNP) using the procedure developed here:
http://pubs.acs.org/doi/abs/10.1021/jp110296y Description
DataCalculations:
The absorbance values for the acetate buffer were subtracted from absorbance values for the reaction mixture recorded by the UV-vis to find a corrected absorbance value that would indicate the absorbance of the AuNP and the BSA only. The corrected absorbance values at 550 nm (The wavelength that Au NP should absorb) were graphed against time. The graph (below) shows that some AuNP were created, as absorbance values do increase. However, it is possible some were destroyed as the absorbance rates do drop slightly starting at 120 min into the procedure.


 NotesThe reaction mixture remained clear for most of the experiment, until towards the end when a slight yellowish tinge appeared. Bashki, et al indicated that the mixture should be purplish in color. This could indicate that the reaction did not occur properly and may need to be repeated.
| |