User:Elaine Marie Robbins/Notebook/CHEM-496/2011/10/05: Difference between revisions
(→Data) |
|||
| Line 53: | Line 53: | ||
<center>[[Image:Integral of intensity vs concentration.jpg|600px]]</center> | <center>[[Image:Integral of intensity vs concentration.jpg|600px]]</center> | ||
Concentrations of MBP solutions: | |||
Blank: 50 mM Tris (7.55 pH) | |||
A: 1397 μM MBP stock + 1603 μM Tris | |||
B: 300 μM A + 2700 μM Tris | |||
C: 300 μM B + 2700 μM Tris | |||
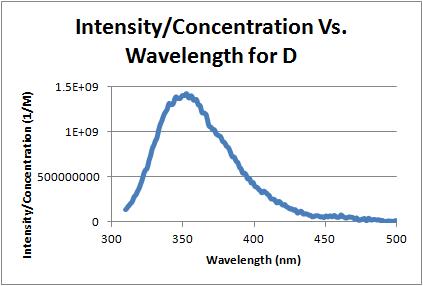
D: 300 μM C + 2700 μM Tris | |||
E: 300 μM D + 2700 μM Tris | |||
<center>[[Image:Intensity over concentration vs wavelength a 10-5-11.jpg|600px]]</center> | |||
<center>[[Image:Intensity over concentration vs wavelength b 10-5-11.jpg|600px]]</center> | |||
<center>[[Image:Intensity over concentration vs wavelength c 10-5-11.jpg|600px]]</center> | |||
<center>[[Image:Intensity over concentration vs wavelength d 10-5-11.jpg|600px]]</center> | |||
<center>[[Image:Intensity over concentration vs wavelength e 10-5-11.jpg|600px]]</center> | |||
==Notes== | ==Notes== | ||
Revision as of 14:29, 10 October 2011
 Fluorimeter Sensitivity II, DNA Purification Fluorimeter Sensitivity II, DNA Purification
|
<html><img src="/images/9/94/Report.png" border="0" /></html> Main project page <html><img src="/images/c/c3/Resultset_previous.png" border="0" /></html>Previous entry<html> </html>Next entry<html><img src="/images/5/5c/Resultset_next.png" border="0" /></html> |
|
ObjectiveFluorimeter Sensitivity II To continue the experiment on 10/04/11 to determine the sensitivity of a fluorimeter using standard concentrations of Ru(bpy)(phen) and determine the fluorescence of MBP as a function of concentration.
To purify the DNA made by cells cultured on 09/27/11. DescriptionFluorimeter Sensitivity II
The DNA purification protocol was adapted from the Wizard Plus SV Minpreps DNA Purification System vacuum protocol found here: DataIntegrated intensity of Ru(bpy)(phen):
40 μM: 2001.315233 60 μM: 2237.400074 80 μM: 2294.581483 100 μM: 2286.935912
This graph shows the integral of fluorescence intensity vs. the concentration of Ru(bpy)(phen). The graph begins to level off at 60 μM, indicating that the Ru(bpy)(phen) is emitting too much light for the fluorimeter at around that point. This is consistent with the findings on 10/04/11

Concentrations of MBP solutions:
A: 1397 μM MBP stock + 1603 μM Tris B: 300 μM A + 2700 μM Tris C: 300 μM B + 2700 μM Tris D: 300 μM C + 2700 μM Tris E: 300 μM D + 2700 μM Tris      Notes
| |