User:Emran M. Qassem/Notebook/Physics 307L/2010/11/29: Difference between revisions

From OpenWetWare
Jump to navigationJump to search
No edit summary
Line 70: Line 70:


===Calculations===
===Calculations===
<br><math>\Pr = \frac{e^{-\lambda} (\lambda)^k}{k!}</math>
Poisson function:
Gaussian function  
::<math>\Pr = \frac{e^{-\lambda} (\lambda)^k}{k!}</math>
:<math>f(x)=\frac{1}{\sqrt{2 \pi \sigma^2}}e^{-\frac{(x-\mu)^2}{2\sigma^2}},\,\!</math>
Gaussian function:
::<math>f(x)=\frac{1}{\sqrt{2 \pi \sigma^2}}e^{-\frac{(x-\mu)^2}{2\sigma^2}},\,\!</math>
 
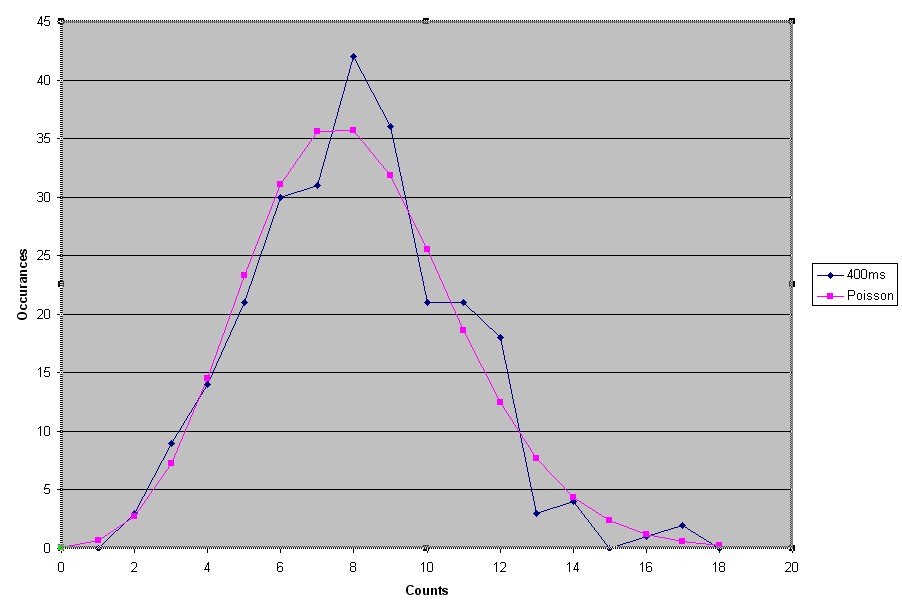
We used these two functions in our graphs to show how our data related to a Poisson distribution, and in the last graph of 1000ms, we also plotted the Gaussian distribution (yellow).


===Error===
===Error===

Revision as of 16:23, 21 December 2010

Poisson Statistics <html><img src="/images/9/94/Report.png" border="0" /></html> Main project page
<html><img src="/images/c/c3/Resultset_previous.png" border="0" /></html>Previous entry<html>&nbsp;&nbsp;&nbsp;&nbsp;&nbsp;&nbsp;</html>Next entry<html><img src="/images/5/5c/Resultset_next.png" border="0" /></html>

Poisson Statistics

Purpose

  • Measure the background radiation by using an NaI detector, and create a poisson distribution.

Equipment

SpecTech equipment
SpecTech equipment (back)
UCS30 Software
  • Computer
    • Windows XP Professional Version 2002 Service Pack 3
    • Intel Celeron CPU 2.26 Ghz
    • 1.96 GB of RAM
  • NaI detector
    • TN-1222 Detector Base
    • Tracor Northern
    • Model # TN-1222
    • SN 880067
    • Bicron Mod 2N2/2
    • SN CK-091
    • +1200 Volts, 1300 Max
  • Spectech Universal Computer Spectrometer, UCS 30
    • Connected to computer with USB Cable
    • Manufactured by Spectrum Techniques inc. Oak Ridge Tennessee 37830
    • Input channel connected to detector Input channel
    • POS High Voltage channel connected to detector HV channel
  • Spectrum Techniques UCS30 Software
    • UCS30 Version 2.10.7, Friday January 23, 2009 - 2:41 PM
    • SN. 505, FW Rev. 6
    • 2006-2007 Spectrum Techniques, Inc.

Safety

  • High voltage, so beware of shock.
  • We measured the background radiation, so there is no danger of radioactive substances.

Setup

SpecTech equipment
Settings Menu
Channel Settings
Dwell time
  • Turned on the power supply.
  • Opened the Spectrum Techniques UCS30 Software on the computer.
  • In the Mode menu, set the software to MCS Internal.
  • In the settings menu, select "Amp/HV/ADC"
  • We set the High Voltage to 1000V.
  • We also set the channels to 256.
  • Then we set the dwell time to 80ms initially.

Procedure

  • Press go.
  • We changed the dwell time to 80, 100, 200, 400, 800, 1000ms and ran the experiment again.
  • For each of these we plotted the occurrences verse the number of counts.
  • Next we plotted the Poisson distribution for each dwell time and the Gaussian distribution for the 1000ms dwell time.


Data

Poisson Statistics XL Doc Poisson distribution function height=500 height=500 height=500 height=500 height=500

Calculations

Poisson function:

[math]\displaystyle{ \Pr = \frac{e^{-\lambda} (\lambda)^k}{k!} }[/math]

Gaussian function:

[math]\displaystyle{ f(x)=\frac{1}{\sqrt{2 \pi \sigma^2}}e^{-\frac{(x-\mu)^2}{2\sigma^2}},\,\! }[/math]

We used these two functions in our graphs to show how our data related to a Poisson distribution, and in the last graph of 1000ms, we also plotted the Gaussian distribution (yellow).

Error

  • The error in our graphs is because we chose to follow the manual and use the lowest number of channels. We used only 256. If we had used more channel we would have gotten more measurements, and therefore a better result. Despite this, all of our graphs except the 800ms and 1000ms graphs match the Poisson distribution closely.

Citations/Acknowledgements