User:Eric Ma/Notebook/MICB323 Lab Book/2009/03/24: Difference between revisions

From OpenWetWare
Jump to navigationJump to search
Line 213: Line 213:
| Day 1 +IFNg||0.10325||10.325||-256.1576355||0
| Day 1 +IFNg||0.10325||10.325||-256.1576355||0
|}
|}
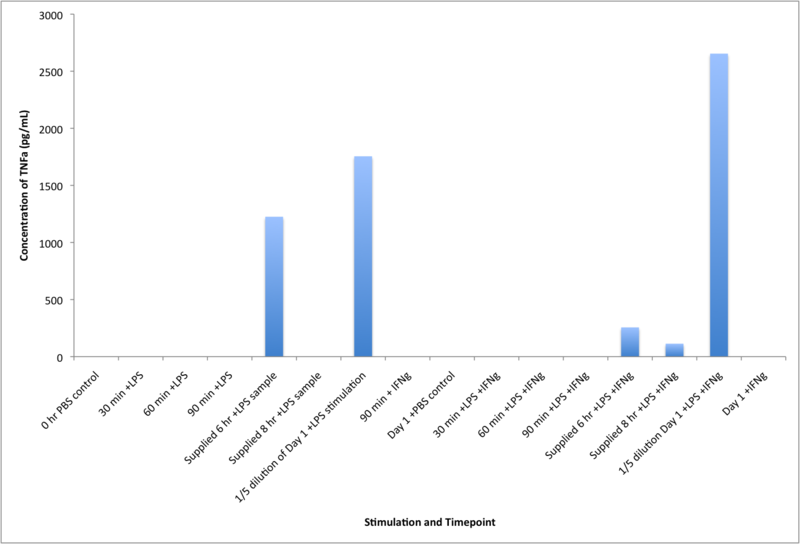
====TNF-alpha Stimulation Timecourse====
[[Image:090324_TNF-alpha_Timecourse.png|800px]]


<!-- ##### DO NOT edit below this line unless you know what you are doing. ##### -->

Revision as of 22:38, 31 March 2009

Project name <html><img src="/images/9/94/Report.png" border="0" /></html> Main project page
<html><img src="/images/c/c3/Resultset_previous.png" border="0" /></html>Previous entry<html>&nbsp;&nbsp;&nbsp;&nbsp;&nbsp;&nbsp;</html>Next entry<html><img src="/images/5/5c/Resultset_next.png" border="0" /></html>

Goals

  1. Perform ELISA to detect TNFa in LPS +/- IFNg stimulated culture supernatants.
  2. Perform PAGE on the IP samples from Lab 8
  3. Western Transfer following PAGE


Part 1: ELISA Detection of TNFa in LPS +/- IFNg stimulated culture supernatants.

96 Well Immunoplate Layout

Row Row 1-4 Row 5-8 Row 9-12
A 0 pg TNFa (assay buffer only) 0 hr PBS control Day 1 +PBS control
B 62.5 pg/mL TNFa 30 min +LPS 30 min +LPS +IFNg
C 125 pg/mL TNFa 60 min +LPS 60 min +LPS +IFNg
D 250 pg/mL TNFa 90 min +LPS 90 min +LPS +IFNg
E 500 pg/mL TNFa Supplied 6 hr +LPS sample Supplied 6 hr +LPS +IFNg
F 1000 pg/mL TNFa Supplied 8 hr +LPS sample Supplied 8 hr +LPS +IFNg
G 2000 pg/mL TNFa 1/5 dilution of Day 1 +LPS stimulation 1/5 dilution Day 1 +LPS +IFNg
H 4000 pg/mL TNFa 90 min + IFNg Day 1 +IFNg

Notes

  • Plate incubation time after addition of samples and antibody solution
    • Started at 3:05PM
    • Have to end by 4:00PM when we add in our Streptavidin-HRP, so incubation time will be no longer than 55 minutes rather than the stipulated 1 hr 30 min.
  • Plate incubation time after addition streptavidin-HRP: 25 minutes
    • Did for only 25 minutes. Hopefully there was enough time for binding to occur.
  • Plate incubation time after addition of TMB: 15 minutes
    • Hopefully there is enough time for color formation.
    • After 15 minutes, there wasn't enough color formation. The concentration isn't high enough for an observable reading. We will leave this ON to get color development; Mrs. Hinze will give us the readings tomorrow. NTS: collect the readings tomorrow!!

Part 2: SDS-PAGE

Eric's Gel

Lane Sample ID Sample Content Volume Pipetted (µL)
1 PAGE pre-stained MW markers 15
2 ES1 IP 24 hr (+)LPS 20
3 ES2 IP 48 hr (+)LPS 20
4 ES3 IP 72 hr (+)LPS 20
5 ES7 IP 24 hr (+)IFNg 20
6 ES8 IP 48 hr (+)IFNg 20
7 ES9 IP 72 hr (+)IFNg 20
8 ES4 IP 24 hr (+)LPS (+)IFNg 20
9 ES5 IP 48 hr (+)LPS (+)IFNg 20
10 ES6 IP 72 hr (+)LPS (+)IFNg 20

Sunny's Gel

Lane Sample ID Sample Content Volume Pipetted (µL)
1 PAGE pre-stained MW markers 15
2 ES10 IP 24 hr control 20
3 ES11 IP 48 hr control 20
4 ES12 IP 72 hr control 20
5 Blue tube 48 hr (+)LPS lysate 10
6 Green tube 72 hr (+)LPS Lysate 10
7 Yellow tube 48 hr (+)IFNg Lysate 10
8 Purple tube 72 hr (+)IFNg Lysate 10
9 Black tube 48 hr (+)LPS (+)IFNg lysate 10
10 Brown tube 72 hr (+)LPS (+)IFNg Lysate 10

Notes

  • The gel ran in a funny manner - it was uneven, and resulted in slanting. As the pattern was identical on both my plate and Sunny's plate (i.e. ours were mirror images of each other), we think it may be due to a voltage problem. The wiring may be causing this.
  • As a result, it will be hard for us to measure any sizes of the proteins.

Part 3: Western Transfer

Notes

  • Preparatory steps were done fine.
  • Left with Mrs. Hinze for downstream processing.

Results

ELISA Results

  • The ELISA results (raw data for Tuesday Lab) are here.

Tabluated Average Absorbance Data

Samples Average Absorbance (A450)
0 pg TNFa (assay buffer only) 0.12875
62.5 pg/mL TNFa 0.141
125 pg/mL TNFa 0.1775
250 pg/mL TNFa 0.2105
500 pg/mL TNFa 0.272
1000 pg/mL TNFa 0.40925
2000 pg/mL TNFa 0.324
4000 pg/mL TNFa 0.95225
0 hr PBS control 0.08575
30 min +LPS 0.09725
60 min +LPS 0.102
90 min +LPS 0.10525
Supplied 6 hr +LPS sample 0.404
Supplied 8 hr +LPS sample 0.13075
1/5 dilution of Day 1 +LPS stimulation 0.2265
90 min + IFNg 0.081
Day 1 +PBS control 0.1085
30 min +LPS +IFNg 0.0855
60 min +LPS +IFNg 0.09325
90 min +LPS +IFNg 0.09925
Supplied 6 hr +LPS +IFNg 0.20725
Supplied 8 hr +LPS +IFNg 0.17825
1/5 dilution Day 1 +LPS +IFNg 0.263
Day 1 +IFNg 0.10325

Standard Curve

Calculated Concentration of TNF-alpha

Samples Average Absorbance (A450) 100X Average Absorbance (A450) Calculated [TNFa] (pg/mL) Normalized [TNFa] (pg/mL)
0 hr PBS control 0.08575 8.575 -342.364532 0
30 min +LPS 0.09725 9.725 -285.7142857 0
60 min +LPS 0.102 10.2 -262.3152709 0
90 min +LPS 0.10525 10.525 -246.3054187 0
Supplied 6 hr +LPS sample 0.404 40.4 1225.369458 1225.369458
Supplied 8 hr +LPS sample 0.13075 13.075 -120.6896552 0
1/5 dilution of Day 1 +LPS stimulation 0.2265 22.65 1754.926108 1754.926108
90 min + IFNg 0.081 8.1 -365.7635468 0
Day 1 +PBS control 0.1085 10.85 -230.2955665 0
30 min +LPS +IFNg 0.0855 8.55 -343.5960591 0
60 min +LPS +IFNg 0.09325 9.325 -305.4187192 0
90 min +LPS +IFNg 0.09925 9.925 -275.862069 0
Supplied 6 hr +LPS +IFNg 0.20725 20.725 256.1576355 256.1576355
Supplied 8 hr +LPS +IFNg 0.17825 17.825 113.3004926 113.3004926
1/5 dilution Day 1 +LPS +IFNg 0.263 26.3 2653.940887 2653.940887
Day 1 +IFNg 0.10325 10.325 -256.1576355 0

TNF-alpha Stimulation Timecourse