User:James C. Schwabacher/Notebook/CHEM-571/2013/09/04: Difference between revisions
From OpenWetWare
(→Notes) |
|||
| (2 intermediate revisions by the same user not shown) | |||
| Line 40: | Line 40: | ||
==Determining the Unknown Inosine Sample== | ==Determining the Unknown Inosine Sample== | ||
# A=εbc, therefore c=A/ε where b=1 cm. | |||
# Excel Linear regression analysis calculates the standard error of the Inosine Group Calibration (ε=11007.433792783 M<sup>-1</sup>cm<sup>-1</sup>) to be 247.476791358845. Thus, the inherent error of the calibration curve is ±200, resulting in ε=11000±200 M<sup>-1</sup>cm<sup>-1</sup> for inosine at 249 nm. | |||
#[[Image:CHEM571_cmj_09.04.13_UVVis_Inosine_Unknown.png]] | #[[Image:CHEM571_cmj_09.04.13_UVVis_Inosine_Unknown.png]] | ||
# | # According to the spectrum collected, at 249 nm the unknown has an absorbance of .047. | ||
# c=A/ε --> c=.047/(11000 M<sup>-1</sup>cm<sup>-1</sup>) --> c= 4.27×10<sup>-6</sup>M | |||
# c=A/ε --> c=.047/( | # The error in the unknown concentration measurement based on the error inherent in the calibration curve is c*sqrt((200/11000)<sup>2</sup>). Therefore, the error in unknown concentration measurement is ±.08×10<sup>-6</sup>M. | ||
#The resulting range is 4.19×10<sup>-6</sup>M to 4.35×10<sup>-6</sup>. HAT's actual concentration for this sample was 4.0×10<sup>-6</sup>M, which does not fall in the range calculated. Our concentration measurement is not in agreement with the actual concentration. | |||
==Notes== | ==Notes== | ||
| Line 51: | Line 54: | ||
[[Category:Adenosine]] | [[Category:Adenosine]] | ||
[[Category:Inosine]] | [[Category:Inosine]] | ||
<!-- ##### DO NOT edit below this line unless you know what you are doing. ##### --> | <!-- ##### DO NOT edit below this line unless you know what you are doing. ##### --> | ||
Revision as of 13:36, 14 September 2013
 Biomaterials Design Lab Biomaterials Design Lab
|
<html><img src="/images/9/94/Report.png" border="0" /></html> Main project page <html><img src="/images/c/c3/Resultset_previous.png" border="0" /></html>Previous entry<html> </html>Next entry<html><img src="/images/5/5c/Resultset_next.png" border="0" /></html> |
|
Objective
Procedure
Data: CMJData: Group
Determining the Unknown Inosine Sample
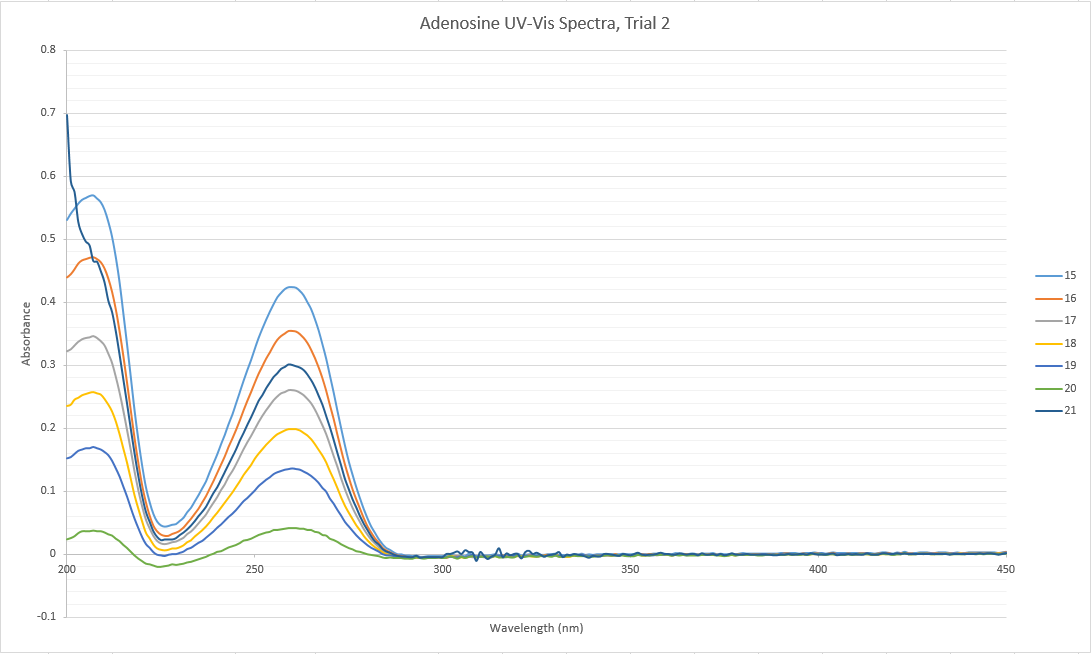
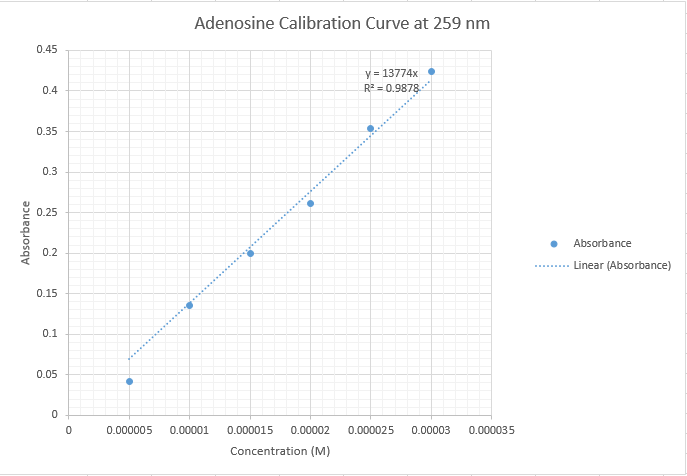
NotesAll of the data collected yesterday was found to be systematically lower than the rest of the class' data. Thus, the data from the inosine trial was not included in the overall group data. Furthermore, a trial 2 of adenosine dilutions was run, using a new stock solution. This second set of data fit with the overall group data, and our first trial was discarded. It is most probable that there was an error in making the first set of stock solutions yesterday that resulted in the incomplete transfer of the massed solids into the 100 mL volumetric flasks. Having a smaller amount of solute in the solvent than calculated would result in systematically lower absorbance results. | |


