User:Jonathan Cline/Notebook/Sensors/20130430: Difference between revisions
From OpenWetWare
Jump to navigationJump to search
No edit summary |
(remove slidy which no longer works on openwetware) |
||
| (10 intermediate revisions by the same user not shown) | |||
| Line 1: | Line 1: | ||
Previously this was a Slidey presentation but OpenWetWare no longer supports that rendering, but the content is still below. | |||
<div class="slide cover"> | <div class="slide cover"> | ||
<br clear="all" /> | <br clear="all" /> | ||
=Microbiology Sensors | =Microbiology Sensors (2013) = | ||
[http://openwetware.org/wiki/User:Jonathan_Cline Jonathan Cline] | [http://openwetware.org/wiki/User:Jonathan_Cline Jonathan Cline] | ||
| Line 24: | Line 17: | ||
<div class="slide"> | <div class="slide"> | ||
= Engineered Biology - Sensors | = Engineered Biology - Microbiology Sensors = | ||
LED Emitter-Detector Sensors | LED Emitter-Detector Sensors | ||
| Line 35: | Line 28: | ||
<div class="slide"> | <div class="slide"> | ||
= Engineered Biology - Sensors | = Engineered Biology - Microbiology Sensors = | ||
LED Emitter-Detector Sensors | LED Emitter-Detector Sensors | ||
| Line 45: | Line 38: | ||
<div class="slide"> | <div class="slide"> | ||
= Engineered Biology - | = Engineered Biology - Microbiology Sensors = | ||
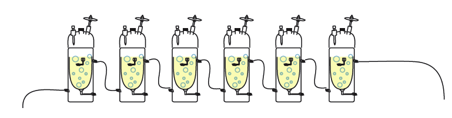
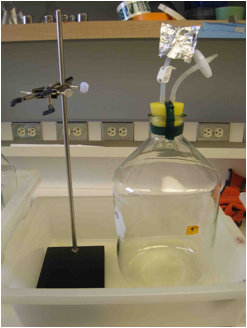
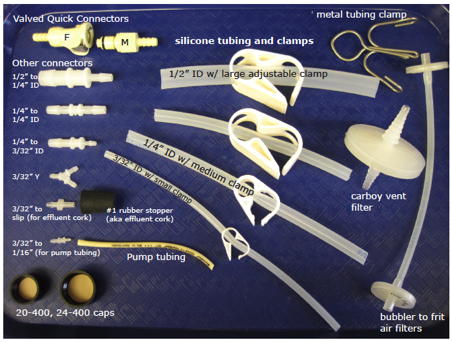
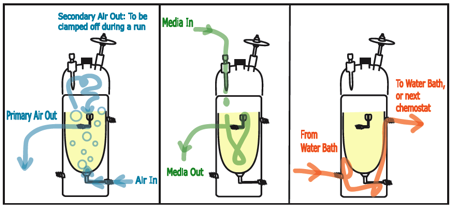
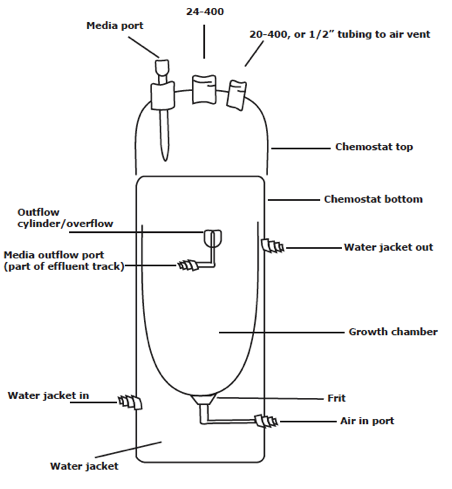
Dunham Lab Chemostat Manual | Dunham Lab Chemostat Manual | ||
| Line 71: | Line 55: | ||
<div class="slide"> | <div class="slide"> | ||
= Engineered Biology - Sensors | = Engineered Biology - Microbiology Sensors = | ||
Dunham Lab Chemostat Manual | Dunham Lab Chemostat Manual | ||
| Line 82: | Line 66: | ||
<div class="slide"> | <div class="slide"> | ||
= Engineered Biology - Sensors | = Engineered Biology - Microbiology Sensors = | ||
Dunham Lab Chemostat Manual | Dunham Lab Chemostat Manual | ||
| Line 92: | Line 76: | ||
<div class="slide"> | <div class="slide"> | ||
= Engineered Biology - Sensors | = Engineered Biology - Microbiology Sensors = | ||
Dunham Lab Chemostat Manual | Dunham Lab Chemostat Manual | ||
| Line 98: | Line 82: | ||
http://dunham.gs.washington.edu/chemostatv2_files/image031.png | http://dunham.gs.washington.edu/chemostatv2_files/image031.png | ||
</div> | |||
<div class="slide"> | |||
= Engineered Biology - Microbiology Sensors = | |||
Quick Visual on Peristaltic Pumps | |||
http://www.springerreference.com/MediaObjects/66/67432/978-0-387-48998-8_16_Part_Fig32_HTML.png | http://www.springerreference.com/MediaObjects/66/67432/978-0-387-48998-8_16_Part_Fig32_HTML.png | ||
</div> | </div> | ||
| Line 104: | Line 96: | ||
<div class="slide"> | <div class="slide"> | ||
= Engineered Biology - Sensors | = Engineered Biology - Microbiology Sensors = | ||
Dunham Lab Chemostat Manual | Dunham Lab Chemostat Manual | ||
| Line 132: | Line 124: | ||
<div class="slide"> | <div class="slide"> | ||
= Engineered Biology - Sensors | = Engineered Biology - Microbiology Sensors = | ||
Dunham Lab Chemostat 'Ministat' Manual | Dunham Lab Chemostat 'Ministat' Manual | ||
http://dunham.gs.washington.edu/DunhamLabMinistats. | http://dunham.gs.washington.edu/DunhamLabMinistats.pdf | ||
http://www.jove.com/files/ftp_upload/50262/50262fig1.jpg | http://www.jove.com/files/ftp_upload/50262/50262fig1.jpg | ||
| Line 143: | Line 135: | ||
<div class="slide"> | <div class="slide"> | ||
= Engineered Biology - Sensors | = Engineered Biology - Microbiology Sensors = | ||
Dunham Lab Chemostat 'Ministat' Video | Dunham Lab Chemostat 'Ministat' Video | ||
| Line 152: | Line 144: | ||
"design and operation of a relatively simple, low cost array of miniature chemostats .. in determination of physiology and in evolution experiments with yeast" | "design and operation of a relatively simple, low cost array of miniature chemostats .. in determination of physiology and in evolution experiments with yeast" | ||
[http://www.jove.com/video/50262/design-and-use-of-multiplexed-chemostat-arrays Design and Use of Multiplexed Chemostat Arrays] | [http://www.jove.com/video/50262/design-and-use-of-multiplexed-chemostat-arrays JOVE (VIDEO): Design and Use of Multiplexed Chemostat Arrays] | ||
Miller, A. W., Befort, C., Kerr, E. O., Dunham, M. J. Design and Use of Multiplexed Chemostat Arrays. J. Vis. Exp. (72), e50262, doi:10.3791/50262 (2013). | Miller, A. W., Befort, C., Kerr, E. O., Dunham, M. J. Design and Use of Multiplexed Chemostat Arrays. J. Vis. Exp. (72), e50262, doi:10.3791/50262 (2013). | ||
* See also: [http://dunham.gs.washington.edu/protocols.shtml Dunham Lab Protocols for use with Chemostats] | |||
</div> | |||
<div class="slide"> | |||
= Engineered Biology - Microbiology Sensors = | |||
Portable LED-array VIS–NIR spectrophotometer/nephelometer | |||
* 7 DEC 1998 | |||
"A portable instrument with a high-speed multiple-wavelength LED array source, and simultaneous detectors for absorbance and 90° nephelometry, was tested from 420 to 950 nm. Absorbance values and simultaneous 90°-scatter intensities at six different wavelengths can be determined and stored every 0.02 s. An advantage of this LED instrument is that its sensitivity is equal to or better than many research-grade spectrophotometers. Also, unlike diode array spectrometers, which emit white light through samples, the LED instrument emits monochromatic light through samples, enabling us to obtain turbidity, turbidity ratio, and particle size information in addition to the absorption spectrum. Field applications can range from simple turbidity and multiple-wavelength absorbance measurements to kinetic experiments with temporal acquisition of multiple-wavelength absorbance and simultaneous turbidity data. Rugged, laptop compatible, portable, and inexpensive, the LED instrument is useful for discrete or on-line VIS–NIR absorption analysis and turbidity, or turbidity ratio, analysis." 1998 John Wiley & Sons, Inc. Field Analyt Chem Technol 2: 21–28, 1998 | |||
</div> | |||
<div class="slide"> | |||
= Engineered Biology - Microbiology Sensors = | |||
==LED Spectrophotometer== | |||
"Hauser et al. [71] employed a fiber optic coupler to guide the light from up to 7 LEDs into a single | |||
measuring cell. This photometer could be configured to detect Al, Cu, NH3, Cu, Ca, chromium, | |||
phosphate and nitrite using colorimetric methods. Acoupler was used to merge the light from one of | |||
the 7 input channels into 2 output fibers. " | |||
"LED as both light source and detector for analytical applications has been developed by Lau et al. The emitter LED is forward biased while the detector LED is reverse biased. ... Additional advantages .. is the size, low power consumption (can operate in microwatts range), can detect low absolute light levels, responds to a broad spectral range (247 to >900 nm) and can achieve good S/N ratio. " | |||
[http://www.mdpi.com/1424-8220/8/4/2453/pdf Absorbance Based Light Emitting Diode Optical Sensors and Sensing Devices] October 2007, Sensors 2008, 8, 2453-2479 | |||
</div> | |||
<div class="slide"> | |||
= Engineered Biology - Microbiology Sensors = | |||
==LED Spectrophotometer== | |||
"Due to outbreaks such as foot and mouth disease, chicken flu virus and bovine spongiform | |||
encephalopathy (BSE) food safety assurance is of utmost importance. LED based chemical sensors | |||
have also been applied to the monitoring of food products [97, 121, 122]." | |||
"Pacquit et al.employed an LED based detector to monitor fish spoilage [97, 123]. The on package | |||
sensor contains the pH sensitive bromocresol green,which responds through visible change to basic | |||
volatile spoilage compounds such as trimethylamine (TMA), ammonia (NH3) and dimethylamine | |||
(DMA) collectively referred to as Total Volatile Basic Nitrogen (TVB-N). " | |||
"Teshima et al.employed an LED based liquid core waveguide (LCW) absorbance detector for the | |||
measurement of gaseous acetone in human breath. Monitoring breath acetone can be useful to follow | |||
patients on a prescribed diet regimen as well as tomonitor diabetic patients. The detection chemistry | |||
was based on the reaction of acetone with alkaline salicylaldehyde to form a coloured product, which | |||
absorbs in the blue and can be monitored with GaN based LEDs (? max465 nm) [126]. " | |||
[http://www.mdpi.com/1424-8220/8/4/2453/pdf Absorbance Based Light Emitting Diode Optical Sensors and Sensing Devices] October 2007, Sensors 2008, 8, 2453-2479 | |||
</div> | |||
<div class="slide"> | |||
= Engineered Biology - Microbiology Sensors = | |||
==Sensing Mercury== | |||
"Mercury is also relatively volatile and, therefore, easily lost during sample preparation and analysis. ... Most of the methods available to determine mercury levels in blood, urine, tissues, and hair use atomic absorption spectrometry (AAS), atomic emission spectrometry (AES), atomic fluorescence spectrometry (AFS), neutron activation analysis (NAA), mass spectrometry (MS), or anodic stripping voltametry (ASV). Cold vapour AAS (or CVAAS) is the most widely used." | |||
[http://www.who.int/foodsafety/publications/chem/mercuryexposure.pdf WHO Guidance for Identifying Populations at Risk from Mercury Exposure August 2008] | |||
</div> | |||
<div class="slide"> | |||
= Engineered Biology - Microbiology Sensors = | |||
==Sensing Mercury== | |||
[http://dx.doi.org/10.1016/S0584-8547(98)00127-X A simple, low cost, multielement atomic absorption spectrometer with a tungsten coil atomizer] | |||
http://ars.els-cdn.com/content/image/1-s2.0-S058485479800127X-gr1.jpg | |||
"This instrument uses an inexpensive tungsten coil atomizer that is extracted from a standard 150 W projector bulb. The temperature of the coil is computer-controlled by changing the voltage across the coil. A low voltage is first used to dry the sample then a higher voltage is used to atomize the sample. Simultaneous detection of the analyte absorption signals is accomplished using a charge-coupled device. The elements of interest in this study were Cd, Pb, and Cu." | |||
</div> | |||
<div class="slide"> | |||
= Engineered Biology - Microbiology Sensors = | |||
==Sensing Mercury== | |||
'''BBC News: Baby food mercury concern''' April, 2003 | |||
"A recent analysis of foods found a quarter of samples contained mercury, which on average was double that when baby food was last analysed three years ago. But experts say it is not yet possible to say if these levels are too high." | |||
[http://news.bbc.co.uk/2/hi/health/2931565.stm Baby food mercury concern] | |||
</div> | |||
<div class="slide"> | |||
= Engineered Biology - Microbiology Sensors = | |||
==Are the 'Experts' really Expert?== | |||
No. | |||
''Washington Post: Is the evidence for austerity based on an Excel spreadsheet error?'' | |||
"By typing AVERAGE(L30:L44) at one point instead of AVERAGE(L30:L49), they left out Belgium, a key counterexample" | |||
"One of the more influential studies that’s often used to argue for austerity has come in for an extensive new critique. ... The paper in question is Carmen Reinhart and Kenneth Rogoff’s famous 2010 study ”Growth in a Time of Debt,” which found that economic growth severely suffers when a country’s public debt level reaches 90 percent of GDP. ... Taken together, those three changes lead to a different analysis. Herndon, Ash, and Pollin conclude that “the average real GDP growth rate for countries carrying a public debt-to-GDP ratio of over 90 percent is actually 2.2 percent, not -0.1 percent as as published in Reinhart and Rogoff.”" | |||
[http://www.washingtonpost.com/blogs/wonkblog/wp/2013/04/16/is-the-best-evidence-for-austerity-based-on-an-excel-spreadsheet-error/ http://www.washingtonpost.com/blogs/wonkblog/files/2013/04/reinhart_rogoff_coding_error_0.png] | |||
</div> | |||
<div class="slide"> | |||
= Engineered Biology - Microbiology Sensors = | |||
[http://openwetware.org/wiki/User:Jonathan_Cline Jonathan Cline] | |||
[mailto:jcline@ieee.org jcline@ieee.org] | |||
© 2013 | |||
http://88proof.com/img/JCLINE-BUSINESS-CARD-320.png | |||
</div> | </div> | ||
Latest revision as of 07:41, 12 August 2020
Previously this was a Slidey presentation but OpenWetWare no longer supports that rendering, but the content is still below.