User:Mary Mendoza/Notebook/CHEM 581: Experimental Chemistry I/2014/09/05: Difference between revisions
From OpenWetWare
Mary Mendoza (talk | contribs) |
Mary Mendoza (talk | contribs) |
||
| Line 8: | Line 8: | ||
==Calibration Curves for Malachite Green Stock Solutions== | ==Calibration Curves for Malachite Green Stock Solutions== | ||
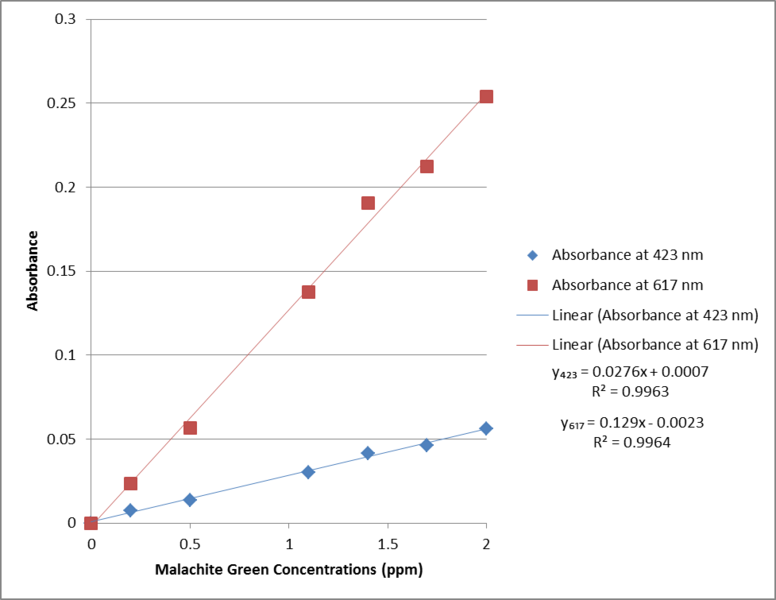
* After saving the data from the data print table with the correct wavelength range (200-800nm), the absorbance at 423 and 617 nm of malachite green were plotted against the concentrations 0.2, 0.5, 1.1, 1.4, 1.7, and 2.0 ppm using MS Excel. The trendline function of MS Excel was used to calculate the linear regression equation for the curves. | * After saving the data from the data print table with the correct wavelength range (200-800nm), the absorbance at 423 and 617 nm of malachite green were plotted against the concentrations 0.2, 0.5, 1.1, 1.4, 1.7, and 2.0 ppm using MS Excel. The trendline function of MS Excel was used to calculate the linear regression equation for the curves. | ||
* The absorbance values for each concentration are provided in the table. | |||
[[Image:MG calibration curve MJJ.png|center|776x600px|thumb|Calibration Curves of Malachite Green concentrations; 0.2, 0.5, 1.1, 1.4, 1.7, and 2.0 ppm, at 423 and 617 nm]] | [[Image:MG calibration curve MJJ.png|center|776x600px|thumb|Calibration Curves of Malachite Green concentrations; 0.2, 0.5, 1.1, 1.4, 1.7, and 2.0 ppm, at 423 and 617 nm]] | ||
[[Image:CCurve values.png]] | |||
==Cross-linking and Neutralizing Batch 3 Films== | ==Cross-linking and Neutralizing Batch 3 Films== | ||
Revision as of 07:44, 10 September 2014
| <html><img src="/images/9/94/Report.png" border="0" /></html> Main project page <html><img src="/images/c/c3/Resultset_previous.png" border="0" /></html>Previous entry<html> </html>Next entry<html><img src="/images/5/5c/Resultset_next.png" border="0" /></html> | |
Calibration Curves for Malachite Green Stock Solutions
 Cross-linking and Neutralizing Batch 3 Films
Batch 4 Film Synthesis
Differential Scanning Calorimetry (DSC) of Sample Films with absorbed Malachite Green (MG)
Fourier Transform Infrared Spectroscopy (FTIR) of MG sample films
 
| |
