User:Matt Hartings/Notebook/AU Biomaterials Design Lab/2016/09/30: Difference between revisions
From OpenWetWare
No edit summary |
|||
| Line 42: | Line 42: | ||
[[Image:20160930 mrh LysozymepH6 scans.png]] | [[Image:20160930 mrh LysozymepH6 scans.png]] | ||
==Myoglobin Fluorescence== | |||
<u>3 mL Sample</u> | |||
# 12.5 μM BSA | |||
## Stock Concentration 160 μM | |||
## Volume Added: 234 μL | |||
# pH 5 | |||
## Stock Concentration 1 mM HCl | |||
## Volume Added: 30 μL | |||
# Volume water added: 2736 μL | |||
<u>UV-Vis of sample</u> | |||
[[Image:20160930 mrh Myoglobin UVVis.png]] | |||
Evidence of protein aggregation (cloudy solution) | |||
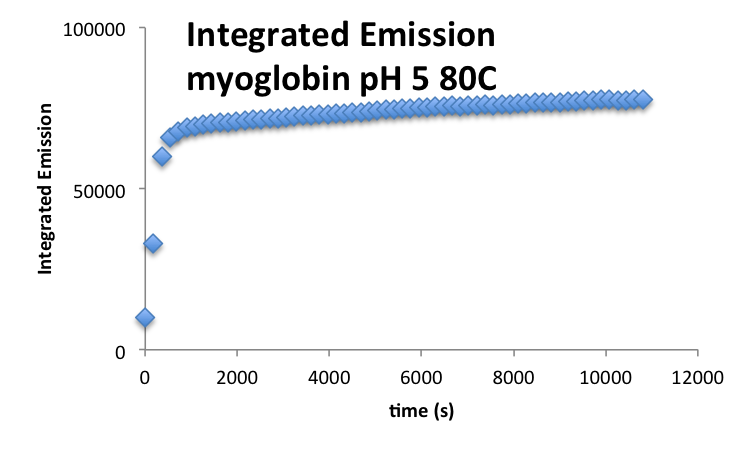
<u>Fluorescence scans</u> | |||
# Acquisition information | |||
## Excitation: 290 nm, 10 nm slit width | |||
## Emission: 310-540 nm, 10 nm slit width | |||
## 100 nm/minute | |||
## 61 measurements, 180 second delay between measurements | |||
[[Image:20160930 mrh MyoglobinpH5 IntegratedI.png]] | |||
[[Image:20160930 mrh MyoglobinpH5 EmissionMax.png]] | |||
[[Image:20160930 mrh MyoglobinpH5 scans.png]] | |||
==Data== | ==Data== | ||
Revision as of 12:47, 30 September 2016
 Biomaterials Design Lab Biomaterials Design Lab
|
<html><img src="/images/9/94/Report.png" border="0" /></html> Main project page <html><img src="/images/c/c3/Resultset_previous.png" border="0" /></html>Previous entry<html> </html>Next entry<html><img src="/images/5/5c/Resultset_next.png" border="0" /></html> |
|
ObjectiveAcquire fluorescence scans of lysozyme (pH 6) and myoglobin (pH 5) at 80C. Lysozyme Fluorescence3 mL Sample
UV-Vis of sample Evidence here of photobleaching of the fluorophore Fluorescence scans
Myoglobin Fluorescence3 mL Sample
UV-Vis of sample Evidence of protein aggregation (cloudy solution) Fluorescence scans
Data
NotesThis area is for any observations or conclusions that you would like to note.
| |


