User:Michael F. Nagle/Notebook/Chem 571/2013/02/13

From OpenWetWare
Jump to navigationJump to search
Project name <html><img src="/images/9/94/Report.png" border="0" /></html> Main project page
<html><img src="/images/c/c3/Resultset_previous.png" border="0" /></html>Previous entry<html>&nbsp;&nbsp;&nbsp;&nbsp;&nbsp;&nbsp;</html>Next entry<html><img src="/images/5/5c/Resultset_next.png" border="0" /></html>


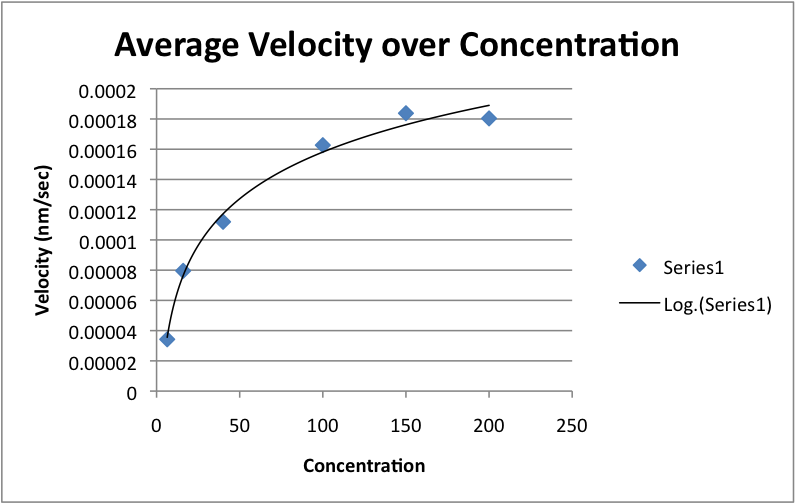
Data

  • All Graphs and Tables are for the Combined Data:
Final Concentration Adenosine (uM) Average velocity over 180 seconds (nm/sec) 1/[Adenosine] (1/uM) 1/average velocity (sec/nm)
200 0.000180385 0.005 5543.691027
150 0.000183794 0.006666667 5440.881764
100 0.000162678 0.01 6147.11077
40 0.000111981 0.025 8930.093256
16 7.95434E-05 0.0625 12571.75005
6.4 3.42451E-05 0.15625 29201.27683


  • Km calculations
Equation Value calculated
(-1)/Km 0.028053516
Km 35.64615572
1/Vmax 4440.372695
Vmax 0.000225206

Notes

  • For run #2 concentration 40 uM was removed as an outlier
  • For run #1 no values for concentration 150 uM were used
  • Ki values for the inhibitors were found in a paper from Planta Medica:
Flavanoid Ki value)
Myricetin 32 uM
Kaempferol 32 uM
Quericetin 26 uM