The printable version is no longer supported and may have rendering errors. Please update your browser bookmarks and please use the default browser print function instead.
 Project name Project name
|
<html><img src="/images/9/94/Report.png" border="0" /></html> Main project page
<html><img src="/images/c/c3/Resultset_previous.png" border="0" /></html>Previous entry<html> </html>Next entry<html><img src="/images/5/5c/Resultset_next.png" border="0" /></html>
|
Objective
Use data collected yesterday to calculate Average values of the Assay and calculate Km
Description
- Calculations using all three assays were performed:
- Velocity by Concentration was graphed for each run
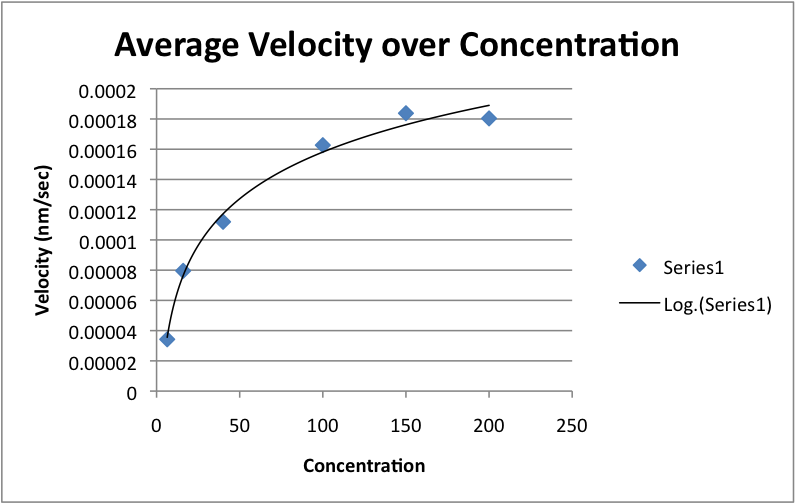
- An average velocity of all three runs was graphed by concentration
- A Lineweaver-Burke Plot was graphed for each run and Km was calculated
- A Lineweaver-Burke Plot was graphed for the average of the three runs and an average Km was calculated
- Error bars were added to the average Lineweaver-Burke Plot by calculating the standard deviation of the three runs 1/velocity values
- Dhea and Mary's first assay data was added to Mike and mine assays to produce an average for four runs
- An Average velocity of combine data was graphed by concentration
- A Lineweaver-Burke Plot was graphed for the average of the combined data and an average Km was calculated
- Error bars were added to the combined data average Lineweaver-Burke plot by calculating the standard deviation of the combined data 1/velocity values
Data
- All Graphs and Tables are for the Combined Data:
| Final Concentration Adenosine (uM)
|
Average velocity over 180 seconds (nm/sec)
|
1/[Adenosine] (1/uM)
|
1/average velocity (sec/nm)
|
| 200 |
0.000180385 |
0.005 |
5543.691027
|
| 150 |
0.000183794 |
0.006666667 |
5440.881764
|
| 100 |
0.000162678 |
0.01 |
6147.11077
|
| 40 |
0.000111981 |
0.025 |
8930.093256
|
| 16 |
7.95434E-05 |
0.0625 |
12571.75005
|
| 6.4 |
3.42451E-05 |
0.15625 |
29201.27683
|

| Equation
|
Value calculated
|
| (-1)/Km |
0.028053516
|
| Km |
35.64615572
|
| 1/Vmax |
4440.372695
|
| Vmax |
0.000225206
|
Notes
- For run #2 concentration 40 uM was removed as an outlier
- For run #1 no values for concentration 150 uM were used
- Ki values for the inhibitors were found in a paper from Planta Medica:
| Flavanoid
|
Ki value)
|
| Myricetin |
32 uM
|
| Kaempferol |
32 uM
|
| Quericetin |
26 uM
|
|

