User:Michael S. Bible/Notebook/CHEM-671/690 Lab Notebook/2016/03/15
| <html><img src="/images/9/94/Report.png" border="0" /></html> Main project page <html><img src="/images/c/c3/Resultset_previous.png" border="0" /></html>Previous entry<html> </html>Next entry<html><img src="/images/5/5c/Resultset_next.png" border="0" /></html> | |
Objective
Protocol
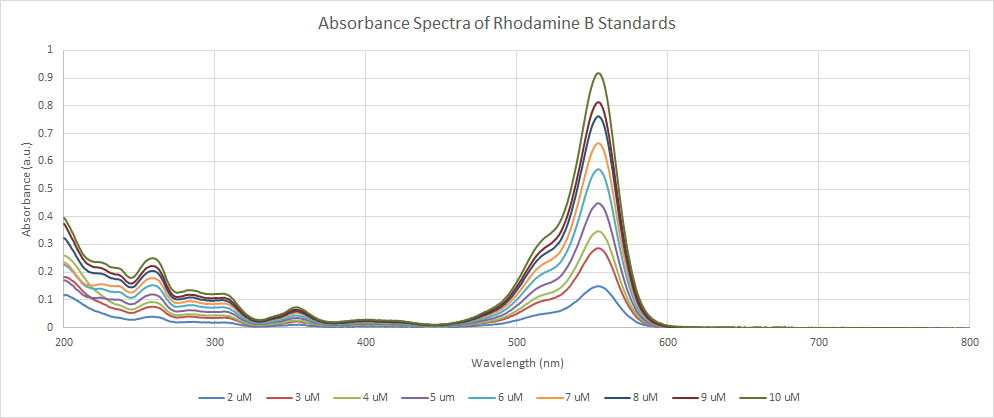
ResultsFigure 1: UV-Vis spectra for 0.1-1 μM Rhodamine B standards. All standards peaked at 555 nm except for samples of concentrations 0.2, 0.3, and 0.5 μM which peaked at 553 nm. The differences in absorbances between these two wavelength's were 1/1000th of an absorbance unit (which may simply be the result of instrument noise or the way the instrument rounds absorbance values to the thousandths place. Figure 2: UV-Vis calibration curve for Rhodamine B. From the figure above, it was evident that the linear range for UV-Vis of Rhodamine B may end at around 0.6 μM. Below that concentration, the UV-Vis response is far less predictable. As a result, higher concentration samples were analyzed. Figure 3: UV-Vis spectra for 2-10 μM Rhodamine B standards. Higher concentrations of Rhodamine B were used to determine if these concentrations could be used practically and analyzed using UV-Vis. Figure 4: UV-Vis calibration curve for Rhodamine B at higher concentrations. The figure above shows a calibration curve that extends the concentrations of Rhodamine B used. Note that the calibration curve is linear and under 1 absorbance unit up to 10 μM Rhodamine B. This indicates that UV-Vis analysis could be a better option to determine the amount of Rhodamine B incorporated by AuNP fibers since higher and more manageable concentrations can be used with the UV-Vis.
| |


