User:Michaela Harper/Notebook/Biological Chemistry Lab/2011/09/07
 Project name Project name
|
<html><img src="/images/9/94/Report.png" border="0" /></html> Main project page <html><img src="/images/c/c3/Resultset_previous.png" border="0" /></html>Previous entry<html> </html>Next entry<html><img src="/images/5/5c/Resultset_next.png" border="0" /></html> |
ObjectiveTo determine the effect of pH on the synthesis of gold nanoparticles, and to repeat the experiment from 08/31/11, which has been optimized. Description
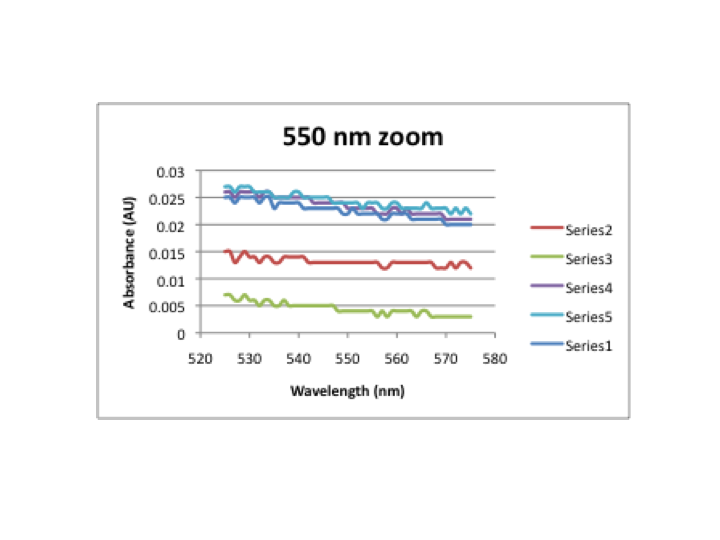
DataThis graph shows the absorbance for each spectrum taken every 30 minutes in buffer. First, a blank spectrum of the buffer solution was taken and subracted from each of the following spectra to create a corrected absorbance. Series 1 represents the spectra taken at t=0, series 2 represents the spectra taken at t=30 minutes, etc up to series 6 representing t=150 minutes. This graph shows the zoomed in features at 550nm in buffer. The changes at 550nm are due to an increase in the baseline, not a new feature. This graph shows the corrected absorbance at 550nm over time in buffer. This represents the concentration of gold nanoparticles that were formed. However, from the zoomed in graph, it is apparent that the changes are due to an increase in the baseline. This graph shows the absorbance for each spectrum taken every 30 minutes in water. First, a blank spectrum of the water was taken and subracted from each of the following spectra to create a corrected absorbance. Series 1 represents the spectra taken at t=0, series 2 represents the spectra taken at t=30 minutes, etc up to series 6 representing t=150 minutes. This graph shows the zoomed in features at 550nm in water. The changes at 550nm are due to an increase in the baseline, not a new feature. This graph shows the corrected absorbance at 550nm over time in water. This represents the concentration of gold nanoparticles that were formed. However, from the zoomed in graph, it is apparent that the changes are due to an increase in the baseline. NotesThese observations may indicate that the experiment did not proceed correctly, as these results were not reported by Bashki, et al. BSA and HAuCl4 solutions were concentrated to be 10x as much as last week. Also, both solutions initially appeared clear with a slight yellowish color. The slight yellow color disappeared with time and solutions became clear. A pocket of cloudy material appeared in the center of the acetate mixture part way through the experiment.
| |


