|
Data Confusion
- Some heavy confusion about what I'm looking at in the frag data. Today's been spent on the internets, figuring out what might be happening. I'm hesitant to go forward with PCRs until I understand a bit more what's going on.
The Evidence
- Panel (gray rectangles) was set up based on the amplicon size ranges described in Lance et al.
- Frag data (pherogram) shows 3 markers amplified to detectable levels (red circles)
- Gel data (purple boxes) from uniplexes are slightly different amplicon sizes
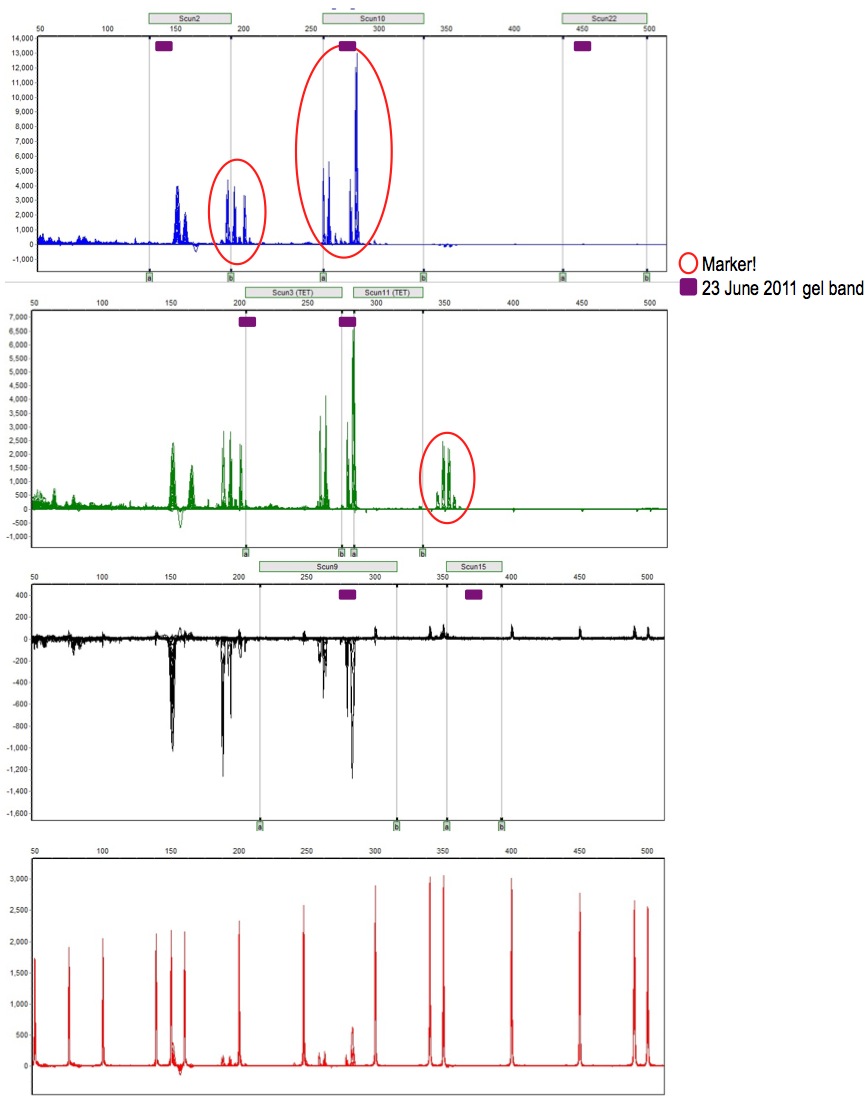
The Possible Explanation
- The dye set I'm using (FAM-TET-HEX) is incompatible with UAGC's instrument set-up (filter set), which expects FAM-VIC-NED
- HEX (what I want to be yellow) has the same optical spectral as VIC (what the instrument calls green)
- thus, it's possible that the instrument didn't see anything labeled with TET, and interpreted those amplicons labeled with HEX to be green
- This would produce a trace with amplicons in unexpected places in the green lane, and an empty yellow lane ... which is exactly what I got
 - the above is what I sent to Jon at UAGC - been communicating with him all day. He's not entirely sure, but says it might be possible to re-run my frag data, if that's what is required.
|

