User:Torsten Waldminghaus/flow cytometry notes
From OpenWetWare
Jump to navigationJump to search
Recipe for flow-TBS
- 1x TBS with 20mM Tris used for flow cytometry in Skarstad-Lab (reduced NaCl concentration from 150mM in the usual TBS to 130mM (everything else is the same).
| for 500 ml |
|---|
| 10 ml 1M Tris-HCl pH 7.5 |
| 13 ml 5M NaCl |
| 477 ml ddH2O |
- Prepare and sterile filter. Store at 4°C.
Use of flow cytometer BD LSR II
- When started new no washing is required but before starting with samples one should press 'Prime' without any liquid (never have 'Prime' with liquid!!!' to let run air run through the system. Than run water on setting "high" on the cytometer (press 'run').
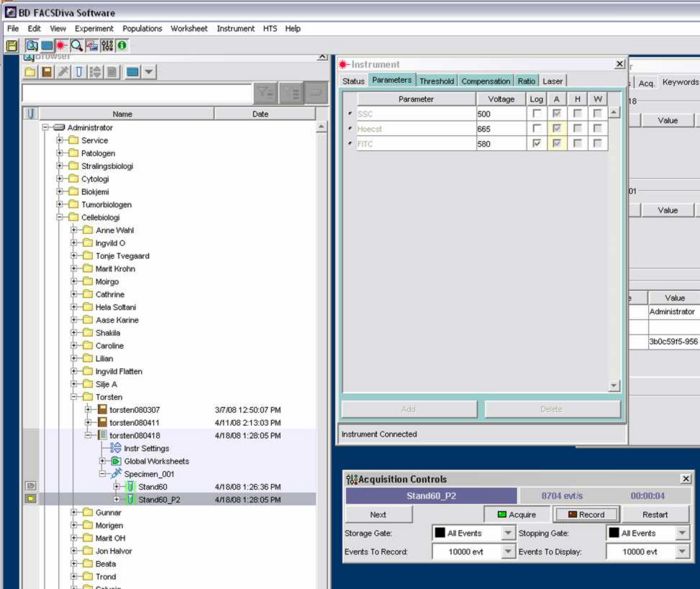
- Start software FACSDiva:

- Select Instrument Configuration
- Select presettings of Gunnar F
- Press 'Set configuration' and OK
- Go to Cellbiology > Torsten > new exp. (brown icon) > rename (torsten date)>
- press syringe icon
- go to 'tube_001' > things will show up on right screen (Without diagramms shown in picture. Those are set in the following):

- make local sheet by pressing on icon beside experiment (left screen)
- Create diagrams:
- Click on DotPlot icon and than on the sheet
- Axes can be changed by clicking on the axe-title (right click)
- Make dot plot with FITC versus Hoechst
- Make 4 histograms:
- Count/SSCA
- Count/Hoechst
- Count/FITC
- Count/Hoechst
- Go to Instruments (window on the right of the left screen) > Parameters > Voltage:
- SSC: 500
- Hoechst: adjust later using the standart /linear scale
- FITC: 580 /log scale
- Go to Instruments > Threshhold:
- Press 'Add' two times; delete SSC and change Hoechst to 5000 for Standard (for samples it should be 2000)
- Go to laser and set windows ext. to 2000
- UV delay is 40.000 and can be changed if one gets strange results. (To change, watch the FITC histogramm when delay is changed. The detected FITC should not go down when delay is changed)
Recording the standard:
- Press "low" at cytometer and insert standard cells
- In the Aquisition Controls window set the following:
- Storage Gate: All
- Events to record(number of cells counted): 10.000
- Number of events should be adjusted with the smal weel to about 1000-1500 (per second)
- The dot plot shows two populations: one with FITC staining and one without
- Lay two windows (vertical) over the dot plot to seperate the two populations (The corresponding name will be P1 and P2)
- Assign FITC-positive cells to one Hoechst-histogram and FITC-negative to the other (right click on diagramm headding > select show population P1/P2)
- Create statistic report by right clicking on the headding of the dot plot and selecting 'stat. view' from the appearing menu
- Adjust Hoechst voltage to fit one-chromosome peak of FITC negative cells to channel 60 (make a vertical window from 50 to 70 and monitor the report which gives the maximum that should be at 60)
=> The FITC positive cells show the peak than at about 40 (FITC quenches the Hoechst staining)
=> The numbers (volts, channel for - and + FITS) should be written in book
- Record 10.000 events by pressing 'Aquire' in the Acquisition window (left screen)
- Change 'Storage Gate' to P2 (FITC +) and record the standard again (for every new record press 'next' in the Acquisition window and give the new sample a suitable name)
- Change the Hoechst voltage to move the one chromosome peak to 15 (This is for fast growing cells to not miss high numbers of chromosomes)
=> Write down parameters (FITC+ should be arround 10.5)
- Record 10.000 events with 'Storage Gate' = All and than only P2
Messure samples:
- Exchange standard with first sample
- Change Hoechst Threshhold to 2000
- Click on 'Next' and rename (short name since WinMDI has problems with long names)
- Watch the event number (1000-1500)
- Move the peak of FITC - cells (standard) to 15
- Record P2 for 10.000 events
Export data:
- Export data as fcs 2.0 files (for WinMDI)to K:\Alle\KF_Flow\Montebello\Torsten Waldminghaus\
- Set the FITC data from log to linear
- Analyze data with WinMDI