BME100 f2014:Group27 L2
Lab Report 2: Statistical Analysis of Inflammotin
Results
Rats
Table 1: Effects of Variable Dosage on Inflammotin Production in Rats
Graph 1: Effects of Variable Dosage on Inflammotin Production in Rats
Human
Table 2: Effects of Variable Dosage on Inflammotin Production in Humans
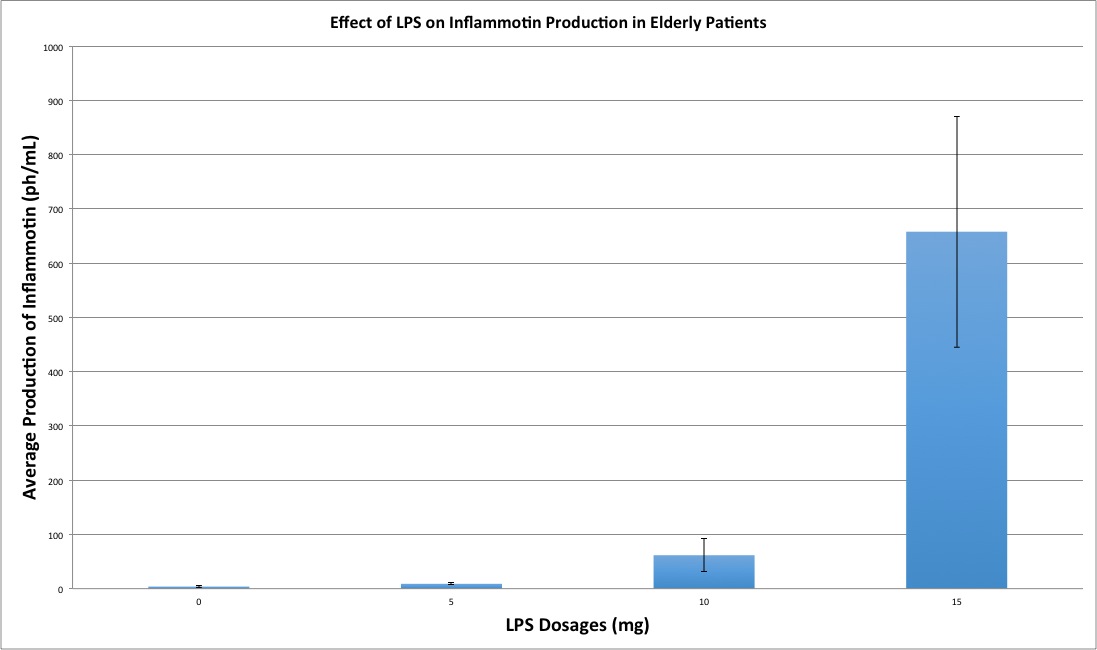
Graph 2: Effects of Variable Dosage on Inflammotin Production in Humans
Analysis
Rats
For the data analysis of the rats a t test must be run, because it properly compares the two groups of rats. Since there are two groups, rats given a 0 mg dosage and rats given a 10 mg dosage, the t test is the most suitable test to conduct to show whether or not there is a statistical difference between the two groups. The t test we ran utilized the data from the figure labeled "Data for the Rats". The values used were from the lists 0 mg and 10 mg. When the t test was conducted with the data from the rat’s production of inflammotin it yielded a p-value of .8674035. This p-value is significantly larger than a p-value of .05. Since our calculated p-value is larger than .05 the t test concludes that our data does not provide enough evidence to show a statistical difference between the two sets of data. This conclusion can be supported by the figure labeled "Graph for the Rats". As seen in this figure the averages are nearly the same with little to no differentiation. However, one thing that is a clear difference is the standard deviation of the two bars. It is clearly shown that the standard deviation associated with the average inflammotin production as a response to a dosage of 10 mg in rats is much larger than that of rats who were given 0 mg as a dosage.
Humans
Table 3: ANOVA Test on Human Data
Table 4: ANOVA Post-Test on Human Data
We initially took the average of each set of data and used that to find the standard deviations. We then found the endpoints to find the standard errors, as seen in “Human Data”. The standard errors are represented in the standard error bars in the “Graph for Humans” image, which also displays a large spike in average production of inflammotin from an LPS dosage of 10 mg to a dosage of 15 mg.
We decided to run an ANOVA test for the human data, which can be seen in the “ANOVA Human Data” image. ANOVA tests work the best for analyzing differences among multiple groups; for humans, we had multiple different dosages that were tested (0, 5, 10, and 15 mg) which meant we had multiple groups of subjects.
We also ran the post-test for ANOVA (seen in “Post-Test for ANOVA Data”) in which we did a t-test between every group. For the t-test for the 0 mg group to the 5 mg group, we got a value of 8.59631E-07. Seeing as this is extremely small (much smaller than our corrected p-value of 0.0125), we can infer that our data was reliable and reflected a true difference in data between these two groups. Similarly, we got a t-test value of 3.01859E-05 for 5 mg to 10 mg, 6.4824E-08 for 10 mg to 15 mg, and 1.39436E-08 for 0 mg to 15 mg, all of which are significantly less than the corrected p-value of 0.0125.
Summary
To reiterate; an ANOVA test was conducted for the human groups due to the fact that there were more than two groups that needed to be compared. Then, after that a post t-test had to be conducted so that a comparison could be made between each interval of dosage of LPS. The results provided enough evidence to conclude that the different dosages of LPS do have significant differences when it comes to production of the inflammotin. Similarly, a t-test was conducted to compare the two different results of inflammotin production as a result of LPS dosages in rats. The t-test provided information that rendered us unable to conclude if there is a significant difference in the production of inflammotin due to different dosages of LPS in rats. The concluding information leads us to believe that LPS is more effective in humans than rats. This is shown by the fact that different intervals of LPS dosages result in significantly different amounts of production of inflammotin in humans. In contrast, the t-test concluded that different dosages of LPS in rats does not lead to a significantly different amount of production of inflammotin.


