BME100 s2014:W Group13 L3
| Home People Lab Write-Up 1 | Lab Write-Up 2 | Lab Write-Up 3 Lab Write-Up 4 | Lab Write-Up 5 | Lab Write-Up 6 Course Logistics For Instructors Photos Wiki Editing Help | ||||||
OUR TEAM
LAB 3A WRITE-UPDescriptive Statistics
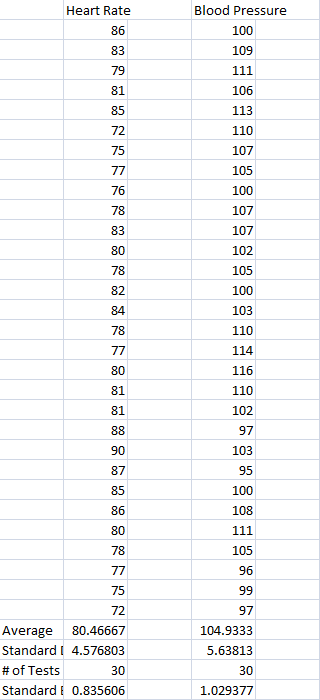
and for our blood pressure and heart rate tests we have: for our heart rate: Results
alongside a Pearson's r = 0.205964 The blood pressure scatter plot: with a Pearson's r = 0.149553 Heart rate scatter plot: with a Pearson's r = 0.710662 Analysis
The blood pressure tests showed interesting results. The average blood pressure for the blood pressure cuff was around 118.05 while the average blood pressure for the wrist sensor was around 112.2833. The t test values for the blood pressure test was around 0.000150953. This t test value shows that it is significance in regards to the standard p value. Finally our heart rate test showed different results. The t test value was different in which it was 0.37578253, which shows that it is not a significant number since it does not satisfy the standard p value of 0.05. Also, the average heart rate was very close in both the devices, 87.9625 and 86.74166667 for the Ox Pulse and wrist wensor respectively. Pearson's number was also positive for all the experiments, each being above the value of 0 but not going beyond the value of 1. Summary/Discussion
Pertaining to the blood pressure test it had similar results, with miniscule differences. This might prove that both devices worked accordingly to their deisgn and are therefore accurate in determining to blood pressure, this is also similar with the heart rate case. The average heart rate graph shows that there was very little differences in both of the devices and they could be performing in similar functions, so there could be no significant difference in using them. Also, the heart rate's Pearson's r showed the greatest amount of correlation with a figure of 0.710662. Overall the medical devices for the blood pressure test and heart rate tests were very good in achieving its goals. LAB 3B WRITE-UPTarget Population and Need
Device DesignOur product will have a similar appearance to a regular bra, however there will be small measuring devices inside the bra that would allow all of its capability of monitoring heart rate and blood pressure to be fully functional, in addition, the bra will be made with flexible and comfortable material that allows comfort in movement for the breast region. Other types of bra will have different styles in them in which the customers can choose whichever style they want along with a multitude of colors to choose from.
Inferential Statistics
Graph
|
||||||


