BME100 s2014:W Group5 L3
| Home People Lab Write-Up 1 | Lab Write-Up 2 | Lab Write-Up 3 Lab Write-Up 4 | Lab Write-Up 5 | Lab Write-Up 6 Course Logistics For Instructors Photos Wiki Editing Help | ||||||
OUR TEAM
LAB 3A WRITE-UPDescriptive StatisticsIn today’s experiment we tested the validity of two relatively new medical devices: a wrist cuff that measures heart rate and blood temperature, and a mobile-linked device for measuring body temperature. Our gold-standards for comparison were a pulse oxometer, a generic blood pressure cuff and an oral thermometer respectively. The class was divided into groups and took several readings from each device in varying states of physical stress; results are as follows:
ResultsRaw data can be viewed on this spreadsheet.
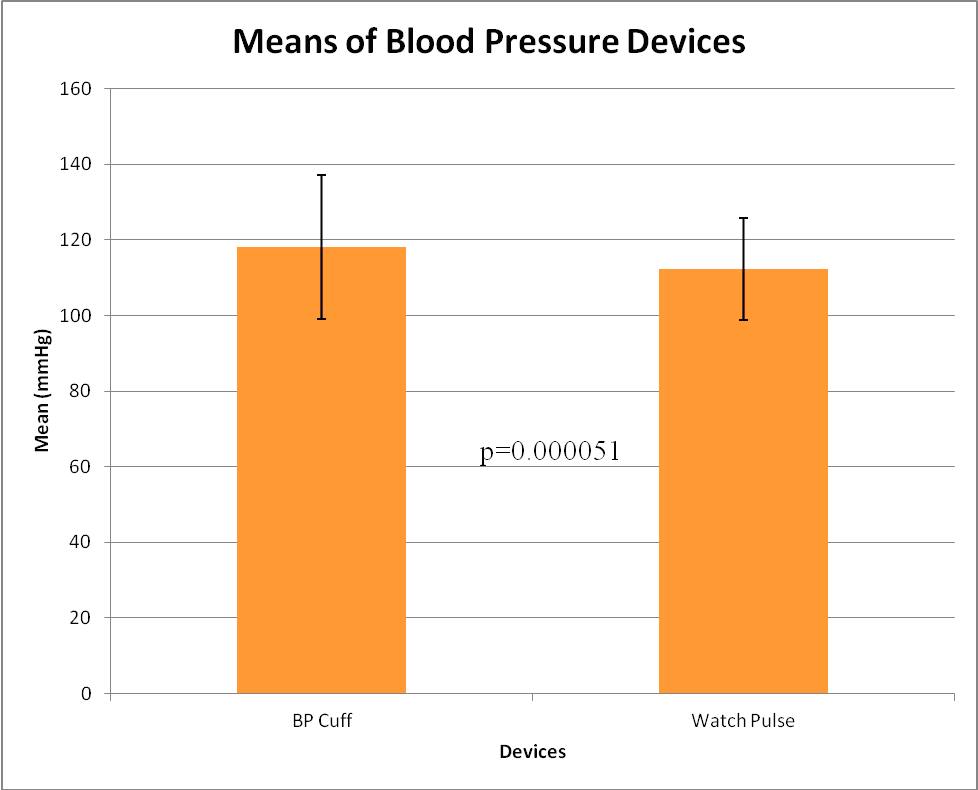
AnalysisDATA: SUMMARY (PULSE) Groups Count Sum Average Variance Pulse Ox 240 21111 87.9625 194.2036 Watch Sensor 240 20818 86.74167 260.9372 ANOVA (PULSE) Source of Variation SS df MS F P-value F crit Between Groups 178.8521 1 178.8521 0.78592 0.375783 3.860986 Within Groups 108778.6 478 227.5704 Total 108957.5 479 SUMMARY (BLOOD PRESSURE) Groups Count Sum Average Variance BP Cuff 240 28332 118.05 365.077 Watch Sensor 240 26947 112.2792 181.8422 ANOVA (BLOOD PRESSURE) Source of Variation SS df MS F P-value F crit Between Groups 3996.302 1 3996.302 14.61387 0.000149 3.860986 Within Groups 130713.7 478 273.4596 Total 134710 479 SUMMARY (TEMPERATURE) Groups Count Sum Average Variance Oral 239 23169 96.94142 1.054117 Sensor 227 21947.8 96.68634 4.763478
Total 1335.001 465
DiscussionPulse Ox Running the heart rate numbers between the pulse oxometer and the watch sensor gave us a P-value of 0.11. As we are looking for a P score of less than 0.05, there is no significant difference between the readings of the pulse oxometer and the wrist cuff. Based on this we can conclude that the cuff is surprisingly accurate in measuring a subject’s heart rate. The Pulse Ox and the Watch Pulse ran an r value of 0.71 which tells us that the Pulse Ox and Watch Pulse had decently close readings. According to the data the Pulse Ox functioned to the standards of the tested device. Improvements would include would be more sensitivity to the finger, where easier detection could be used. Blood Pressure Analysis of variance on the comparison between the BP cuff and watch sensor returned a P-value of 0.000149. This value is far smaller than 0.05, which means the difference between readings from the blood pressure cuff and the watch sensor is statistically significant and as such means future readings from the wrist cuff are likely to be way off those of the generic blood pressure cuff. Although the watch sensor passed the validity test for measuring heart rate, it fails at getting an accurate reading for blood pressure. The r value for the Blood-Pressure Watch and the Blood Pressure cuff was .15 meaning their readings were not remotely close to each other. Improvements with the blood pressure cuff would be a longer range so the results could be more accurate. Temperature The ANOVA run for temperature yielded a P-value of 0.104368. Once again looking for a P score > 0.05, this means there is no significant difference between the results gathered from the mobile-linked device and the oral thermometer and as such the experimental device passed the validity test. Given these results, we can accurately predict that the body temperature sensor will give the subject an accurate temperature reading. Improvements with the mobile-linked device would detection in other areas besides the armpit. The reading in the armpit resulted in discomfort.
LAB 3B WRITE-UPTarget Population and NeedThe Handy Bandy is a revolutionary product that could aid the wounds of humankind. Patients tend to remove the scab of a wound with a traditional bandage; Handy Bandy eliminates this issue.Compound Tincture of Benzoin (CTB)is applied to the gauze of the bandage so that it does not adhere to the wound. This application is critical in the healing of the wound. Another innovation critical to Handy Bandy's success is that it notifies the user when the wound is completely healed. A small, amount of molecular bromine is infused with the bandage where light cannot reach it. In the presence of alkenes, Br-Br bonds break in a radical reaction and the bold red color of the bromine ion is exposed. It is assumed that healed skin forms alkene bonds when completely healed. Statistical analysis is applied to the bromine test. The status of the wound is checked against the temperature of the wound and the bromine test. The two sets were found to be statistically identical with respect to the range of temperature that indicated a healed wound and when the bromine test indicated red.
Device DesignThe Handy Bandy is a band-aid/bandage-like device that keeps track of when it is ready to be changed or removed. The device monitors variables such as dryness, temperature and other factors that may indicate the wound has healed enough for the band-aid to be removed, the dressing is dirty or an infection is developing. Diagram above demonstrates the colour-change of the band-aid.
Inferential StatisticsA spreadsheet of the raw data may be accessed here.
Graph
|
||||||


