Endy:Victor3 plate reader/Absorbance labels
Absorbance
The wavelength of the light can be in the range 320-800nm.
The intensity of the beam is measured without any sample (I0) first and then each well is measured (I). The absorbance is calculated from -
[math]\displaystyle{ A = -log(I/I_0) }[/math]
Because the optical surfaces of the empty well reflect backward about 8% of optical energy, the measured absorbance values are always about 0.04 for an empty clear plate. On our machine, this background appears to be about 0.036.
Absorbance at 600nm
To calculate cell density, we measure the absorbance of the culture at 600nm using the OD600 label.
Linearity

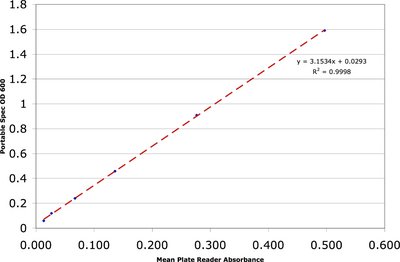
To confirm that the absorbance reading is linear with respect to the culture density, the following experiment was performed. A stationary phase culture of BL21 in LB media was serially diluted in water by factors of 2. Plate reader and portable spec. measurements were made on all dilutions. The portable spec. was blanked with water and a water backgound was subtracted from all the plate reader measurements. All measurements were made in triplicate. The graph to the right shows that over the range 0.013 to 0.846, absorbance is linear with respect to concentration. Since the portable spec. saturates at an OD600 of 2, the plate reader can be used to measure a wider range of cell densities directly.
Calibration

It is useful to convert from absorbance measurements to OD600. Rather than trying to measure the path length, we instead calibrate the absorbance readings from the OD600 label to readings from the portable spec.. The graph on the right is based on the data shown above for linearity. Plotting plate reader and portable spec. readings against each other and fitting a trend line, produces an equation relating plate reader absorbance at 600nm to OD600. Note that the calibration depends on:
- The volume of the suspension added to each well. The plate reader measurements of the calibration curve were performed with 200ul/well. Since on the plate reader, the light beam goes through the sample vertically, adding a different amount of volume will result in a different path length, resulting in a different absorbance value.
- This calibration may depend on the cells/media that you use for your experiment. It may be worth repeating for your particular case. A similar experiment on a different sample, yielded a very similar calibration. See the bottom figure.
