File:ExampleStackedHistograms.png
From OpenWetWare
Jump to navigationJump to search
Size of this preview: 800 × 600 pixels. Other resolution: 1,200 × 900 pixels.
Original file (1,200 × 900 pixels, file size: 10 KB, MIME type: image/png)
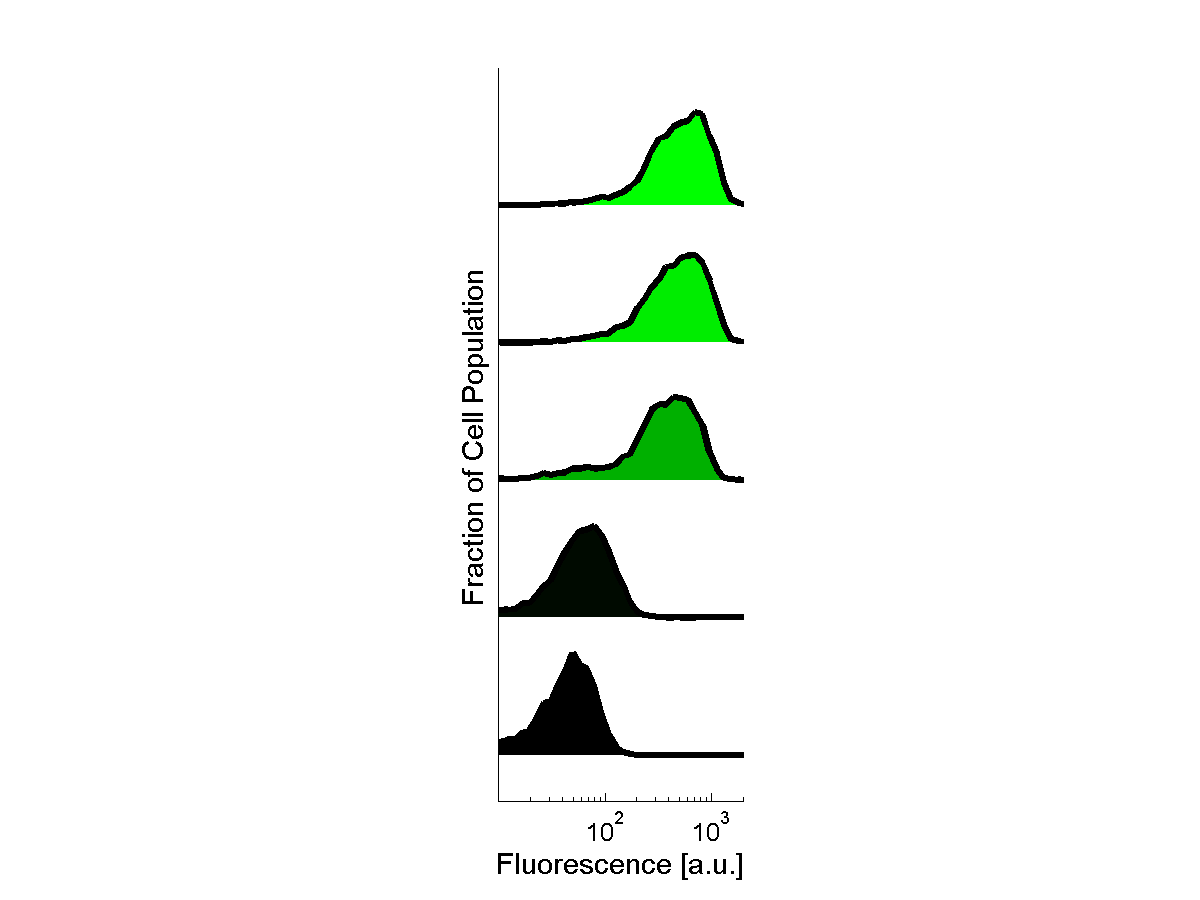
Example of how to plot stacked histograms of FACS data.
File history
Click on a date/time to view the file as it appeared at that time.
| Date/Time | Thumbnail | Dimensions | User | Comment | |
|---|---|---|---|---|---|
| current | 15:15, 17 July 2013 | | 1,200 × 900 (10 KB) | Megan N McClean (talk | contribs) | Example of how to plot stacked histograms of FACS data. |
You cannot overwrite this file.
File usage
The following page uses this file: