File:Fluorescence at 510nm versus time-s-.png
From OpenWetWare
Jump to navigationJump to search
Size of this preview: 800 × 432 pixels. Other resolution: 1,186 × 640 pixels.
Original file (1,186 × 640 pixels, file size: 72 KB, MIME type: image/png)
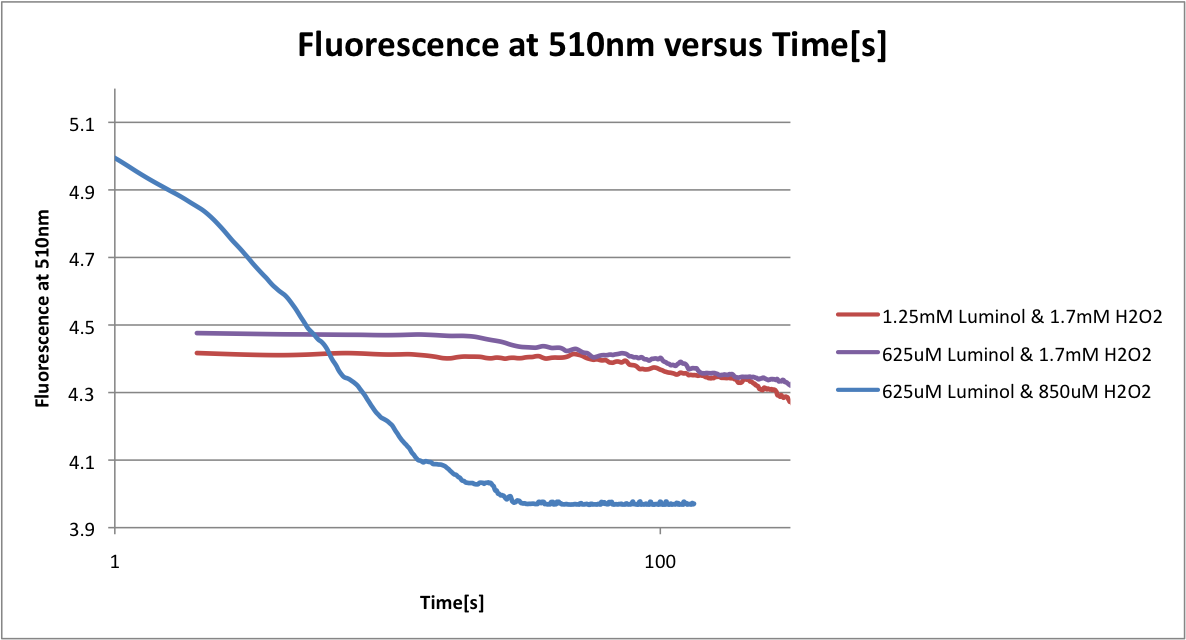
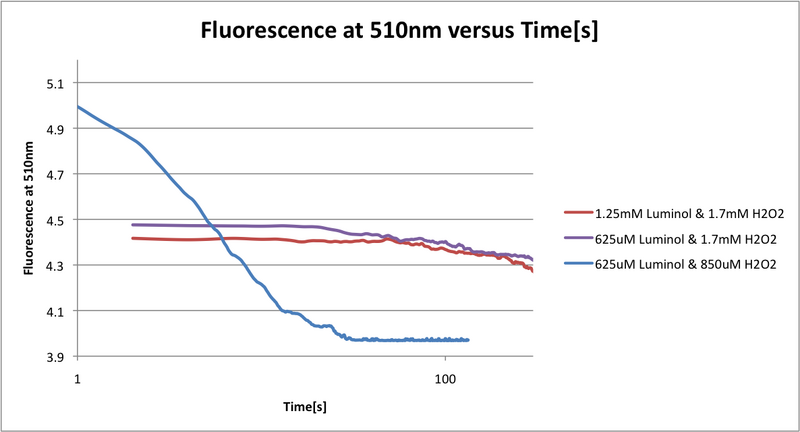
Graph plotted fluorescence at 510nm versus time in seconds. Only three sets of samples were run: 1.25mM luminol and 1.7mM H2O2, 625uM luminol and 1.7mM H2O2, and 625uM luminol and 850uM H2O2. Within the samples also added 18mM 4-iodophenol and 2.3uM horseradish peroxidase.
File history
Click on a date/time to view the file as it appeared at that time.
| Date/Time | Thumbnail | Dimensions | User | Comment | |
|---|---|---|---|---|---|
| current | 04:51, 25 September 2012 | | 1,186 × 640 (72 KB) | Keyun Wang (talk | contribs) | Graph plotted fluorescence at 510nm versus time in seconds. Only three sets of samples were run: 1.25mM luminol and 1.7mM H2O2, 625uM luminol and 1.7mM H2O2, and 625uM luminol and 850uM H2O2. Within the samples also added 18mM 4-iodophenol and 2.3uM horse |
You cannot overwrite this file.
File usage
The following 2 pages use this file:
