Plank's Constant
Plank's Constant Lab Summary
SJK Incomplete Feedback Notice

My feedback is incomplete on this page for two reasons. First, the value of the feedback to the students is low, given that the course is over. Second, I'm running out of time to finish grading!
Brief Overview

In this lab we tried to find the value of Plank's constant by measuring the stopping potential of of emitted light and plotted the potential versus the frequency of the light being measured. In doing this we can help prove the photo-electric effect, by demonstrating that the frequency of light (which determines the energy of the photons) is the factor that plays into ejecting electrons from a metal sheet, not the intensity. After plotting our values and using LINEST, we found our measurement to be [math]\displaystyle{ h=6.190(2)*10^{-34}Js }[/math] which is off by 6.63% from the accepted value: [math]\displaystyle{ 6.626*10^{-34}Js }[/math].
Explanation of Procedure
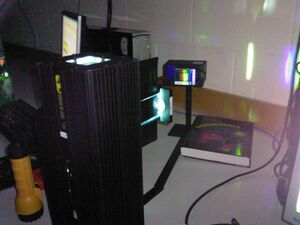
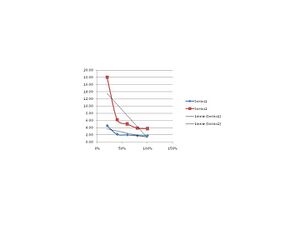
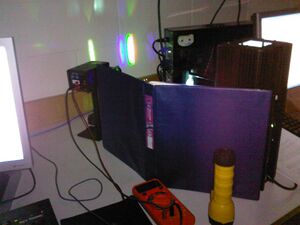
During the first experiment we used light filters and measured the time it took for the h/e device to reach its stopping potential for one band of light. After that we plotted the data as shown below. What this experiment proved was that the intensity of light does not determine the stopping potential, only the frequency.SJK 18:02, 16 December 2009 (EST)

See John's notebook for explanation that the curves should have 1/x (not linear) behavior.

For the second experiment we measured the stopping potential for each band of light, we then plotted the potential versus the frequency, using a least squares fit we were then able to find the value of h.
[math]\displaystyle{ h=6.190(2)*10^{-34}Js }[/math]
The small change for the standard deviation hints to me that the error on my experiment could be due to standard error, however, since I only took first order measurements I am not sure how the second order measurements could have influenced my results.

Questions
I did notice that the stopping potential did drop when using the filters, the drop didn't occur until after we used the 60% light filters. I'm a little at a loss as to why that would happen. Also when we tried to measure the red band we noticed that it's frequency was far larger than that of green and yellow, we believed this to be because the ultraviolet band may have been interfering into the red, also, I don't think that the red color would even have enough energy to eject an electron. Still it was a curiosity that could not be ignored, so we went further and tried to use a red filter from a set of 3D glasses to see if we could eliminate the ultraviolet interference, the result was a reading on the multimeter that was in agreement with with the red and yellow band readings. However, when plotted into the stopping potential vs frequency our h result came out to be even further out from the accepted value([math]\displaystyle{ h = 5.4900(7) * 10^{-34} }[/math]).
Other links
Plank's Constant Lab Notes
Lab Manual
My lab partner, John Callow