Talk:Physics307L:People/Mondragon/Formal Lab Report
to do
Correct error estimation on lambda values Done, Maybe error lambda is where avg(sqrt(chisquare)) is twice its minimum value No, error on x should be sqrt(lambda)
New Plots for eveything. Smooth plot for poisson fit for comparison to actual data. seperate plots for each run, instead of animation.
comparison of fits obtained lambda from chi square vs lambda from data averaging --Tomas A. Mondragon 14:42, 31 October 2007 (CDT)
plots of what chisquare min looks like
--Tomas A. Mondragon 14:46, 31 October 2007 (CDT)
error on [math]\displaystyle{ \lambda }[/math] definetly wrong
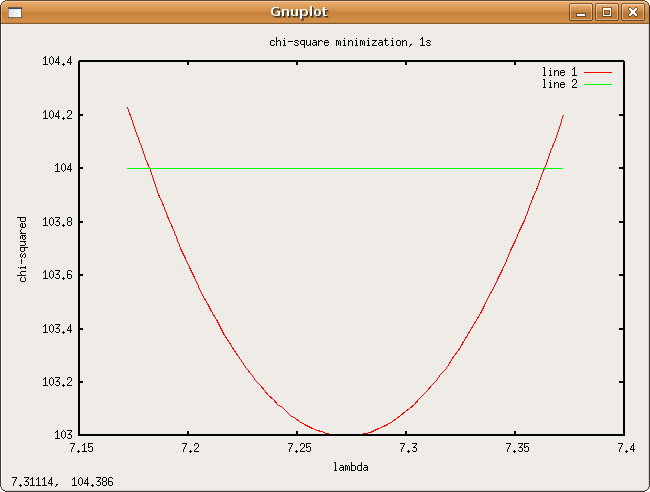
the error on [math]\displaystyle{ \lambda }[/math] is the interval where [math]\displaystyle{ S(\lambda_{best}\pm\Delta\lambda)-S(\lambda)=1 }[/math]
where [math]\displaystyle{ S(\lambda)=\frac{\sum_k{\left(f(\lambda,k)-\tfrac{x_k}{256}\right)^2}}{\sigma^2} }[/math]
[math]\displaystyle{ \sigma^2=\frac{\sum_{k=0}^{\operatorname{max}\ k}{(f(\lambda_{best},k)-\tfrac{x_k}{256})^2}}{\operatorname{max}\ k} }[/math]
MAIN NOTEBOOK ENTRY
Physics307L:People/Mondragon/Notebook/071003--Tomas A. Mondragon 13:53, 2 November 2007 (CDT)
RECALCULATED DATA
10 ms
- [math]\displaystyle{ \lambda }[/math] from chi-square minimization = 0.0261205
- Average deviation from fit = 0.0013743
- [math]\displaystyle{ \lambda }[/math] from average of data = 0.042969
- Average deviation from fit = 0.0028351
- fit plot
- [math]\displaystyle{ \chi^2 }[/math] plots
- [math]\displaystyle{ \Delta\lambda }[/math] = 0.0010149
20ms
- [math]\displaystyle{ \lambda }[/math] from chi-square minimization = 0.0736898
- Average deviation from fit = 0.0029991
- [math]\displaystyle{ \lambda }[/math] from average of data = 0.10938
- Average deviation from fit = 0.0052407
- fit plot
- [math]\displaystyle{ \chi^2 }[/math] plots
- [math]\displaystyle{ \Delta\lambda }[/math]=0.0023908
40ms
- [math]\displaystyle{ \lambda }[/math] from chi-square minimization = 0.185892
- Average deviation from fit = 0.0082640
- [math]\displaystyle{ \lambda }[/math] from average of data = 0.32422
- Average deviation from fit = 0.015304
- fit plot
- [math]\displaystyle{ \chi^2 }[/math] plots
- [math]\displaystyle{ \Delta\lambda }[/math] = 0.007938
80ms
- [math]\displaystyle{ \lambda }[/math] from chi-square minimization = 0.457154
- Average deviation from fit = 0.0014991
- [math]\displaystyle{ \lambda }[/math] from average of data = 0.70703
- Average deviation from fit = 0.020735
- fit plot
- [math]\displaystyle{ \chi^2 }[/math] plots
- [math]\displaystyle{ \Delta\lambda }[/math] = 0.022045
100ms
- [math]\displaystyle{ \lambda }[/math] from chi-square minimization = 0.468385
- Average deviation from fit = 0.0079525
- [math]\displaystyle{ \lambda }[/math] from average of data = 0.62891
- Average deviation from fit = 0.012870
- fit plot
- [math]\displaystyle{ \chi^2 }[/math] plots
- [math]\displaystyle{ \Delta\lambda }[/math] = 0.011267
200ms
- [math]\displaystyle{ \lambda }[/math] from chi-square minimization = 0.937453
- Average deviation from fit = 0.013170
- [math]\displaystyle{ \lambda }[/math] from average of data = 1.2070
- Average deviation from fit = 0.016055
- fit plot
- [math]\displaystyle{ \chi^2 }[/math] plots
- [math]\displaystyle{ \Delta\lambda }[/math] = 0.033847
400ms
- [math]\displaystyle{ \lambda }[/math] from chi-square minimization = 2.58578
- Average deviation from fit = 0.013153
- [math]\displaystyle{ \lambda }[/math] from average of data = 2.7617
- Average deviation from fit = 0.013404
- fit plot
- [math]\displaystyle{ \chi^2 }[/math] plots
- [math]\displaystyle{ \Delta\lambda }[/math] = 0.08610
800ms
- [math]\displaystyle{ \lambda }[/math] from chi-square minimization = 5.74562
- Average deviation from fit = 0.0074780
- [math]\displaystyle{ \lambda }[/math] from average of data = 6.0234
- Average deviation from fit = 0.0078470
- fit plot
- [math]\displaystyle{ \chi^2 }[/math] plots
- [math]\displaystyle{ \Delta\lambda }[/math] = 0.08421
1s
- [math]\displaystyle{ \lambda }[/math] from chi-square minimization = 7.27233
- Average deviation from fit = 0.0065399
- [math]\displaystyle{ \lambda }[/math] from average of data = 7.3242
- Average deviation from fit = 0.0065502
- fit plot
- [math]\displaystyle{ \chi^2 }[/math] plots
- [math]\displaystyle{ \Delta\lambda }[/math] = 0.09070
10s
- [math]\displaystyle{ \lambda }[/math] from chi-square minimization = 73.9022
- Average deviation from fit = 0.0074556
- [math]\displaystyle{ \lambda }[/math] from average of data = 73.766
- Average deviation from fit = 0.0074574
- fit plot
- [math]\displaystyle{ \chi^2 }[/math] plots
- [math]\displaystyle{ \Delta\lambda }[/math] = 0.6182
linefit of [math]\displaystyle{ \lambda }[/math] versus dwell time
Dr. gold's linefit function seems to lend to much weight to the data collected at the beginning. This is understandable because a bunch of datapoints are bunched together there, giving them more credibility, so to speak, than the lonely point at dwell time=10s mark. Polyfit, which dosnt weigh points at all, provides a better fit in my opinion.
- poly fit to line: [math]\displaystyle{ \lambda = 0.007411*dwelltime(ms)-0.209179 }[/math]


