|
Objective
To determine how pH affects the synthesis of gold nanoparticles (AuNP) using the procedure developed here:
Bakshi, Mandeep S.; Kaur, Harpreet; Khullar, Poonam, Banipal, Tarlok, S.; Kaur, Gurinder; Singh, Narpinder Journal of Physical Chemistry C 2011, 115(7), 2982-2992
http://pubs.acs.org/doi/abs/10.1021/jp110296y
Description
- Combine 10 mL of 50 mM acetate buffer (pH 5.46) with 1.1×10⁻³ g of .0015 mM bovine serum albumin (BSA) and 4.0×10⁻⁴ g of 0.25 mM chloroauric acid (HAuCl4) in a capped test tube at room temperature.
- Use a small amount of distilled water to aid in transferring measured quantities to capped test tube.
- Take UV-vis spectra (200 nm to 800 nm) at room temperature of a sample of buffer and reaction mixture.
- Place reaction mixture in an oven at 80°C for 2.5 hr under thermostatic conditions.
- Continue to take UV-vis spectra of reaction mixture at room temperature every 30 minutes.
- After 2.5 hr, remove from oven and cool to room temperature; leave sitting overnight.
Data
Calculations:
- Determining the mass of HAuCl4 needed for a concentration of 0.25 mmol/L in 10 mL of acetate buffer solution.
- 0.25 mmol/L HAuCl4 × (1 mol/1000 mmol) = 2.5×10⁻⁴ mol/L HAuCl4
- 10 mL solution × (1 L/1000mL) × (2.5×10⁻⁴ mol HAuCl4/1 L) × (196.967 g Au3+/1 mol) = 4.9×10⁻⁴ g AuCl4
- Determining the mass of BSA needed for a concentration of 0.0015 mmol/L in 10 mL of acetate buffer solution.
- 0.0015 mmol/L BSA × (1 mol/1000 mmol) = 1.5×10⁻⁶ mol/L BSA
- 10 mL solution × (1 L/1000 mL) × (1.5×10⁻⁶ mol BSA/1 L) × (66776 g BSA/1 mol) = .0010 g BSA
Results:
The absorbance values for the acetate buffer were subtracted from absorbance values for the reaction mixture recorded by the UV-vis to find a corrected absorbance value that would indicate the absorbance of the AuNP and the BSA only.
The corrected absorbance values at 550 nm (The wavelength that Au NP should absorb) were graphed against time. The graph (below) shows that some AuNP were created, as absorbance values do increase. However, it is possible some were destroyed as the absorbance rates do drop slightly starting at 120 min into the procedure.

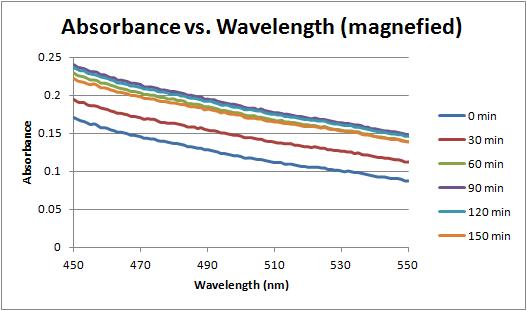
In addition, a second graph showing corrected absorbance against wavelength was created, to shed light on which time the AuNP began to form.

Another version of this graph, showing the absorbance from 0 to 0.5 was also created to better illustrate the changes at 550 nm. It appears the changes are due to a change in the baseline reading, rather than an increase due to nanoparticle production.
Notes
The reaction mixture remained clear for most of the experiment, until towards the end when a slight yellowish tinge appeared. Bashki, et al indicated that the mixture should be purplish in color. This could indicate that the reaction did not occur properly and may need to be repeated.
|  Synthesizing Gold Nanoparticles


