User:Megan L. Channell/Notebook/Horseradish/2013/09/04
From OpenWetWare
 Biomaterials Design Lab Biomaterials Design Lab
|
|
Adenosine and Inosine UV-Vis and AnalysisObjective
The inosine samples came from yesterday's protocol
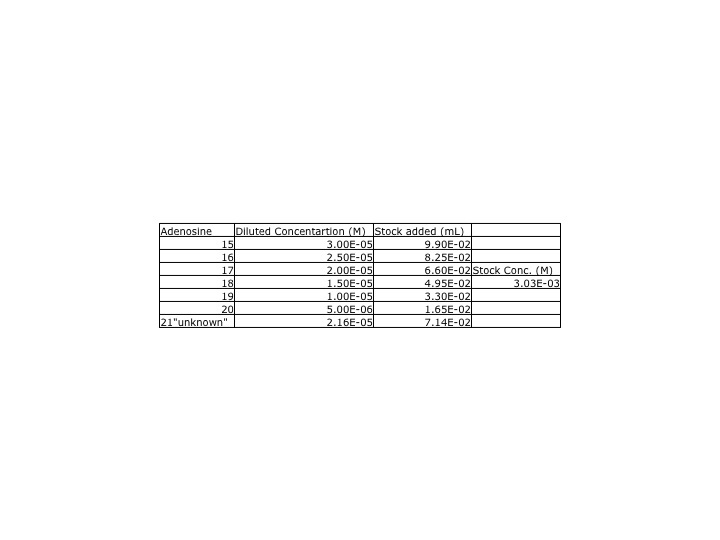
ProtocolYesterday, our adenosine dilutions were much lower than the class' average, so we redid the adenosine samples. A new stock solutions was made using yesterday's protocol and the stock solutions was made from .0809g of adenosine. DataA UV-Vis spectra of the new adenosine samples and the inosine samples were collected. The parameters for the UV-Vis were measured between 450 and 200nm. The peak for the insonie spectra was at 249nm while the adenosine was 259nm. This wavelength was used when calculating the calibration curve.
Data
G=|mean-x|÷std. dev.
| |


