Avalekander Week 12
Purpose
The purpose of this experiment is to further explore the Tai et al 2007 and 2005 papers in an attempt to understand how to simulate a two nutrient chemostat using MatLab. Additionally, it reinstates the importance of providing replicable methods in research publications.
Methods
Steps performed
- First, table 1 in the Tai et al (2007) paper (References) was analyzed to further understand the variables involved and what they represent.
- Through external research and analysis of the sources referenced by the Tai et al (2007) paper, specifically the previous 2005 paper, as well as the information given in lecture, the variables involved in a two-nutrient chemostat were better comprehended.
- Model parameters were determined through some minor calculating and plugged into a simulation model for a two-nutrient chemostat.
- The MATLAB files chemostat_script.m and chemostat_dynamics.m were modified to simulate a two-nutrient chemostat, found here.
- Lastly, the model was run and the results in the form of a graph were compared to those simulated in the Tai et al (2007) paper.
Equations:
- Biomass rate of change: dx/dt = x[r(y/y+K)(z/z+L)] - qx
- Glucose rate of change: dy/dt = -Ex[r(y/y+K)(z/z+L)] - qy + qu
- Ammonium rate of change: dz/dt = -Fx[r(y/y+K)(z/z+L)] - qz + qv
- Y Glu/X: This quantity represents the biomass yield of glucose. It compares a ratio of grams of residual glucose to grams of glucose consumed.
- flux qGlu: This represents the dilution rate, or the ratio of glucose (mmol/gram) being added to the system over 1 hour (t).
- Glucose at 12 degrees C:
Residual ammonia: 1.110g Residual glucose: 0.054g
- Glucose at 30C:
Residual glucose: 0.054g Residual ammonia: 1.11g
- Ammonium at 12C:
Residual glucose: 16.214g Residual ammonia: 0.026g
- Ammonium at 30C:
Residual glucose: 15.331g
Residual ammonia: 0.003g
Time: The data was collected after values were constant for 3 volume changes, resulting in a total of 100 hours.
Other parameters:
r: maximum grown rate
K: concentration of glucose at r/2
E: efficiency of glucose (14.29)
u: feed concentration of glucose (25g/L in C-lim, 46g/L in N-lim)
q: dilution rate (0.03 h^-1)
F: efficiency of ammonium
L: concentration of ammonium at r/2
v: feed concentration of ammonium (5g/L in C-lim, 0.65g/L in N-lim)
2-nutrient model comparison:
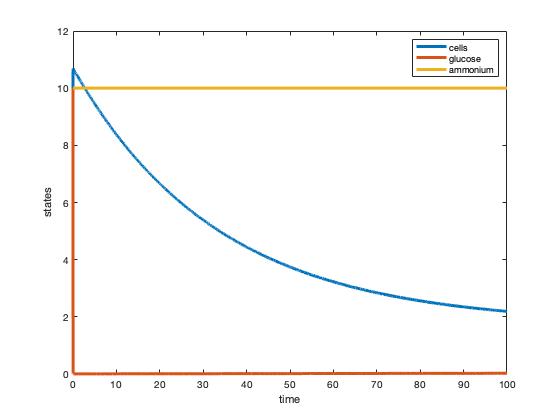
The graphs developed showed the ammonium and glucose abruptly leveling off in glucose's case and flat-lining for the ammonium which seems a bit off. The cells do show a steady decline however which would make sense appearing that a steady state was reached. The steady states in these graphs however do not match those in Tai et al's (2007) Table 1.
Results
Calculation converting residual glucose and ammonia from mM to grams.
Fig. 1: Plot of two-nutrient chemostat simulation of nitrogen-limited cultures at 30 degrees C.
Fig. 2: Plot of two-nutrient chemostat simulation of carbon-limited cultures at 30 degrees C.
Conclusion
Through analyzing table 1 in the Tai et al (2007) paper a more thorough understanding of the variables was developed. Without the explicit stating of these variables, the reader has a significant amount of extra work to be done if choosing to replicate the experiment. The exact values for some parameters were then calculated and plugged into Matlab to simulate a two-nutrient chemostat model. The graphs developed from this model (figure 1 & figure 2) show different steady states than those stated in Tai et al's (2007) paper. Both simulated graphs showed glucose to be immediately consumed and differing rates of ammonium consumption.
Acknowledgements
I would like to acknowledge my homework partner, Edward who helped me to complete this assignment. Except for what is noted above, this individual journal entry was completed by me and not copied from another source. Avalekander (talk) 19:13, 26 April 2019 (PDT)
References
- Dahlquist, K. & Fitzpatrick, B.G. (2019, April 16). BIOL388/S19:Week 12. Retrieved from https://openwetware.org/wiki/BIOL388/S19:Week_12 on 26 April 2019.
- MATLAB (Version R2014b) [Computer software]. (n.d.). Retrieved 26 April 2019.
- Tai, S. L., Boer, V. M., Daran-Lapujade, P., Walsh, M. C., de Winde, J. H., Daran, J. M., and Pronk, J. T. (2005). Two-dimensional transcriptome analysis in chemostat cultures: combinatorial effects of oxygen availability and macro- nutrient limitation in Saccharomyces cerevisiae. J. Biol. Chem. 280, 437–447.
- Tai, S. L., Daran-Lapujade, P., Walsh, M. C., Pronk, J. T., & Daran, J. M. (2007). Acclimation of Saccharomyces cerevisiae to low temperature: a chemostat-based transcriptome analysis. Molecular Biology of the Cell, 18(12), 5100-5112. DOI: 10.1091/mbc.e07-02-0131
Biology 388 Assignments
- Template: Ava Lekander
- User Page: Ava Lekander
- Journal Entries:
- Assignment Pages:
- Class Journal Pages:
- Biology 388 Home Page: BIOL 388 Class Page

