BME100 f2015:Group17 1030amL3
| Home People Lab Write-Up 1 | Lab Write-Up 2 | Lab Write-Up 3 Lab Write-Up 4 | Lab Write-Up 5 | Lab Write-Up 6 Course Logistics For Instructors Photos Wiki Editing Help | ||||||||||||||||||||||||||||||||||||||||||||||||||||||||||||||||||||||||||||||||||||||||
|
OUR TEAM
LAB 3A WRITE-UPDescriptive Statistics
Results
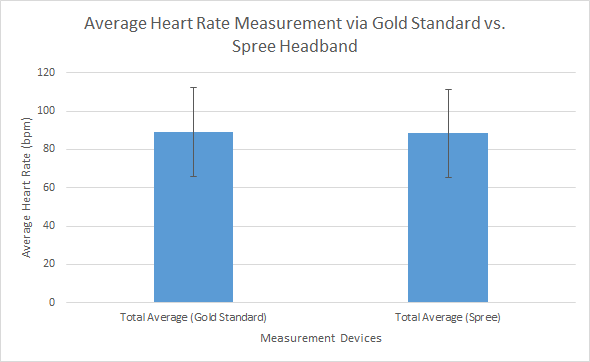
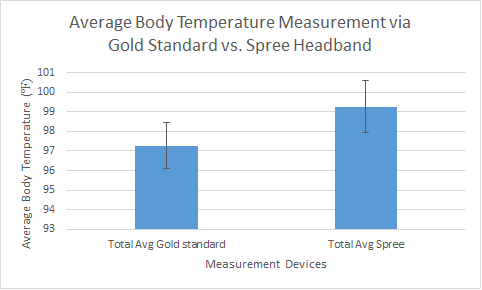
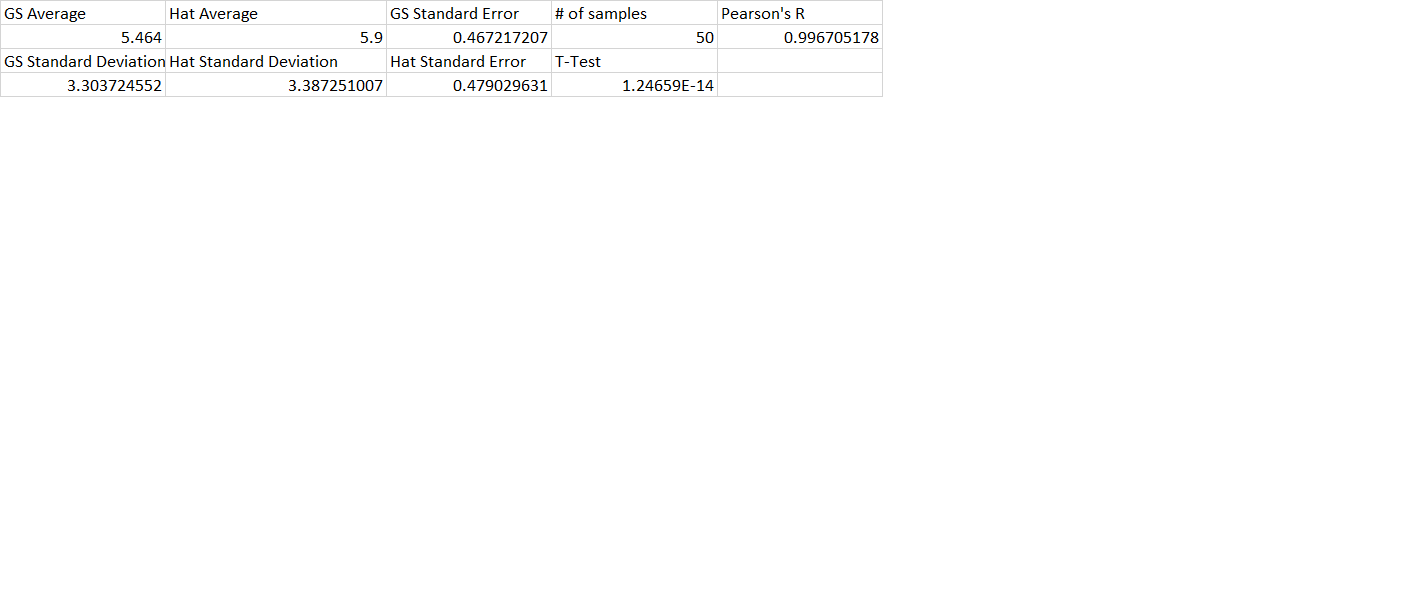
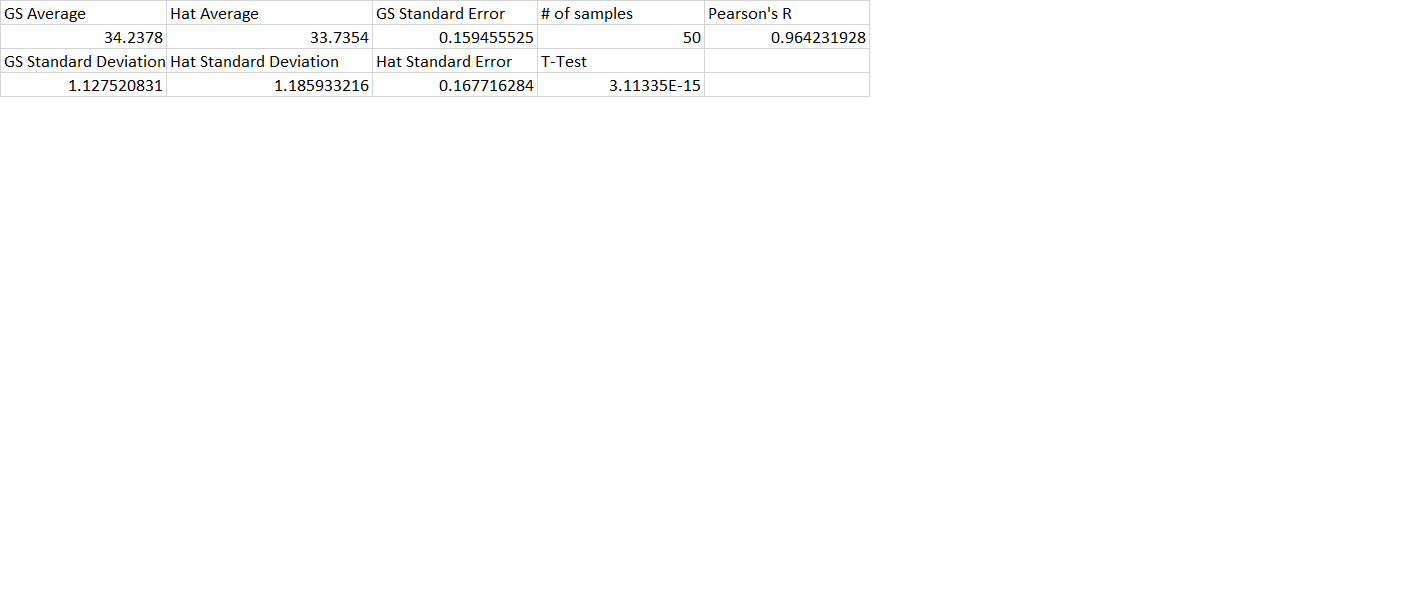
AnalysisIn this lab, we were tasked to test heart rate and temperature accuracy compared to a gold standard. Our null hypothesis would be that the spree results and the gold standard results are the same. We test this hypothesis by running two T-Tests, one for heart rate and one for temperature. We perform a T-Test because within heart rate and temperature there are two groups, the gold standard and spree data. Our heart rate Pearson's R was 0.823329451 and our body temperature Pearson's R was 0.167425906. The heart rate Person's R showed strong correlation while body temperature showed weak correlation. Our T value for heart rate was 0.390217623 which doesn't cross our threshold alpha value of 0.05 meaning there is no statistical significance. For heart rate we fail to reject the null hypothesis. Our T value for temperature was 4.7E-77 which is well below our threshold alpha value of 0.05 meaning there is statistical significance. For temperature we reject the null hypothesis.
Summary/DiscussionWhen recording data, there was a comparison between gold standards and the Spree values. When recording temperature, an oral thermometer was used as the gold standard. There was very little correlation with the Spree band and the thermometer based on the Pearson R value (0.16). The closer this value is to 0, the less correlation there is between the data sets. When the Spree headband was compared to the oxidizer, our gold standard for measuring heart rate, the Pearson R value was (.823). This value shows that the gold standard and Spree values correlate well, though not perfectly. 100% correlation would involve a Pearson R value of 1. In conclusion, the Spree tracked heart rate more accurately than body temperature. After using this headband, there were some obvious design flaws that should be addressed. First, the headband is not aesthetically pleasing; the band is bulky and has unnecessary geometric patterns covering it. After wearing the band for over an hour, it began to feel hot and uncomfortable which lead to headaches. Also, there is an unappealing red mark left on the forehead after prolonged use. In accordance with the data, the temperature recording device on the Spree is not accurate. Overall, this device is very overpriced when compared to cheaper devices that have many of the same capabilities if not more. To help combat most of these design flaws, changing the device from a headband to a chest or wrist strap would prevent unappealing looks as well as an uncomfortable feeling on the head. To provide more accurate temperature readings, it would be ideal to implement a thermometer which gives actual numbers instead of colors. As for the issue of pricing, either Spree needs to price more competitively, or the company should include more features that other cheaper devices do not include such as in depth summary/analysis of workouts and more accurate vital readings.
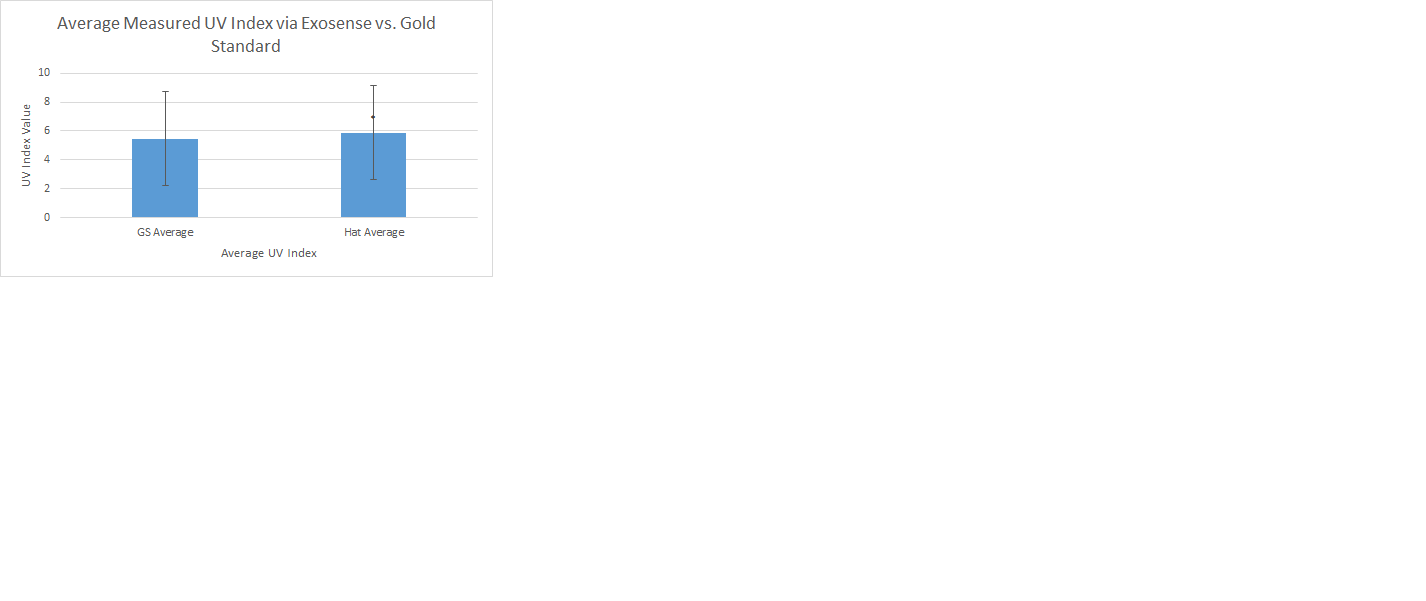
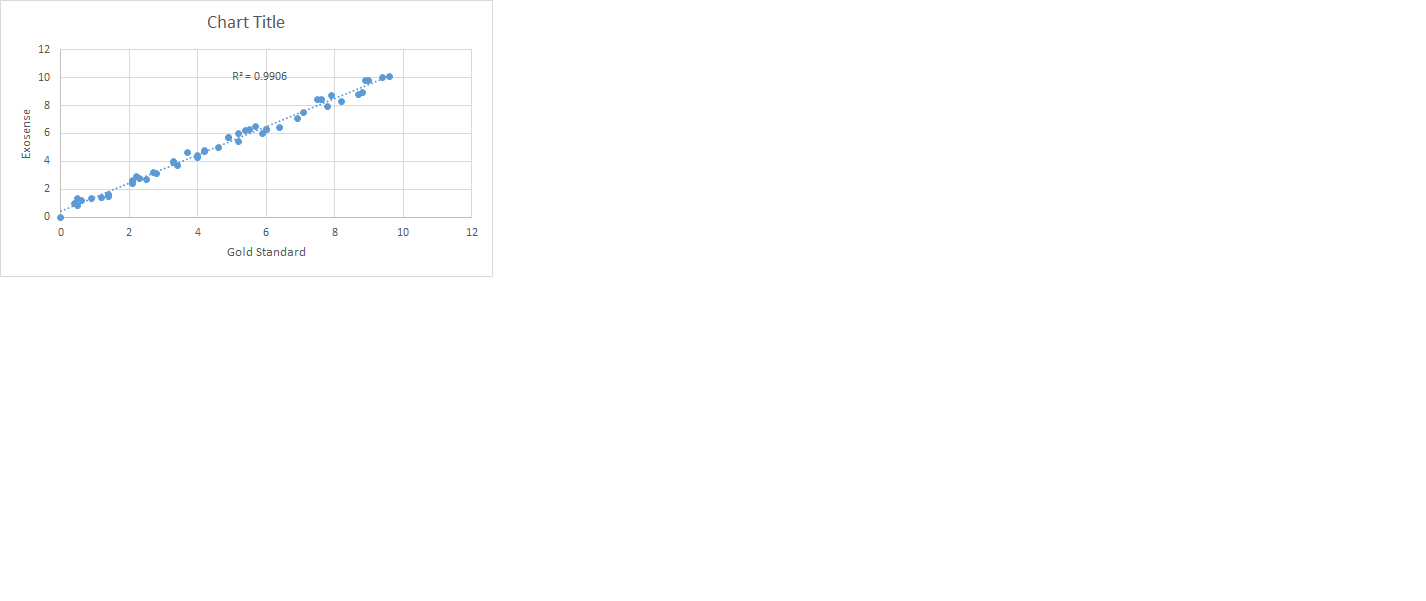
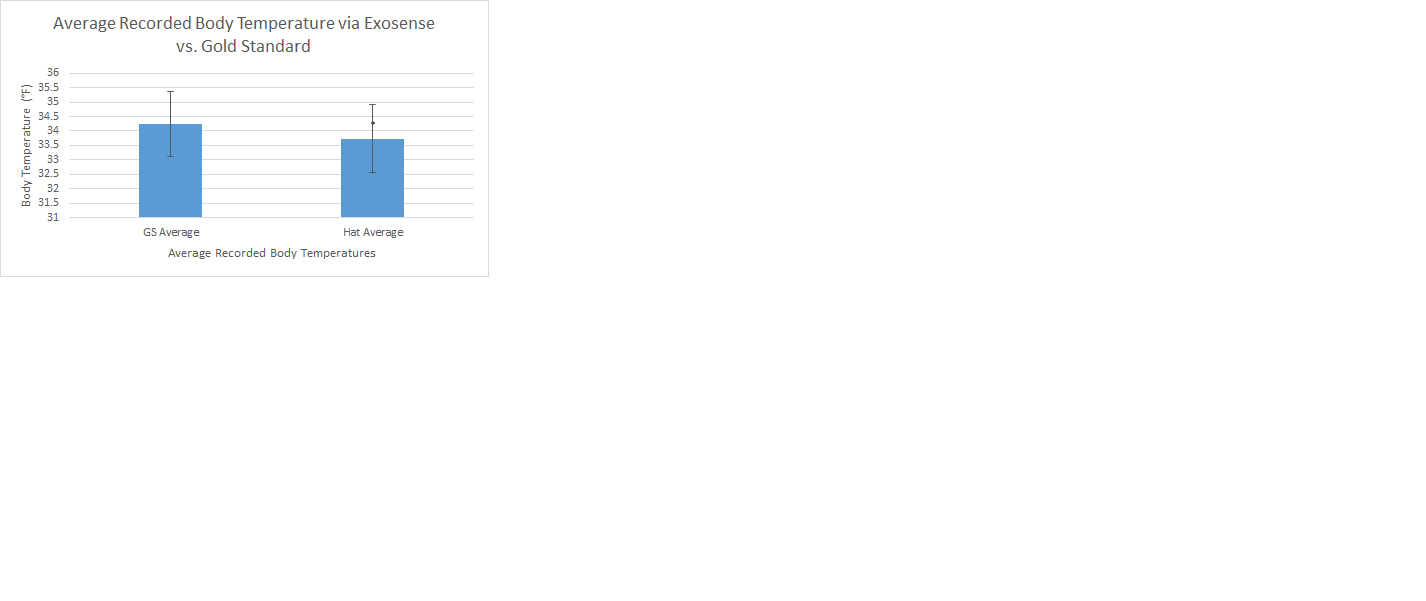
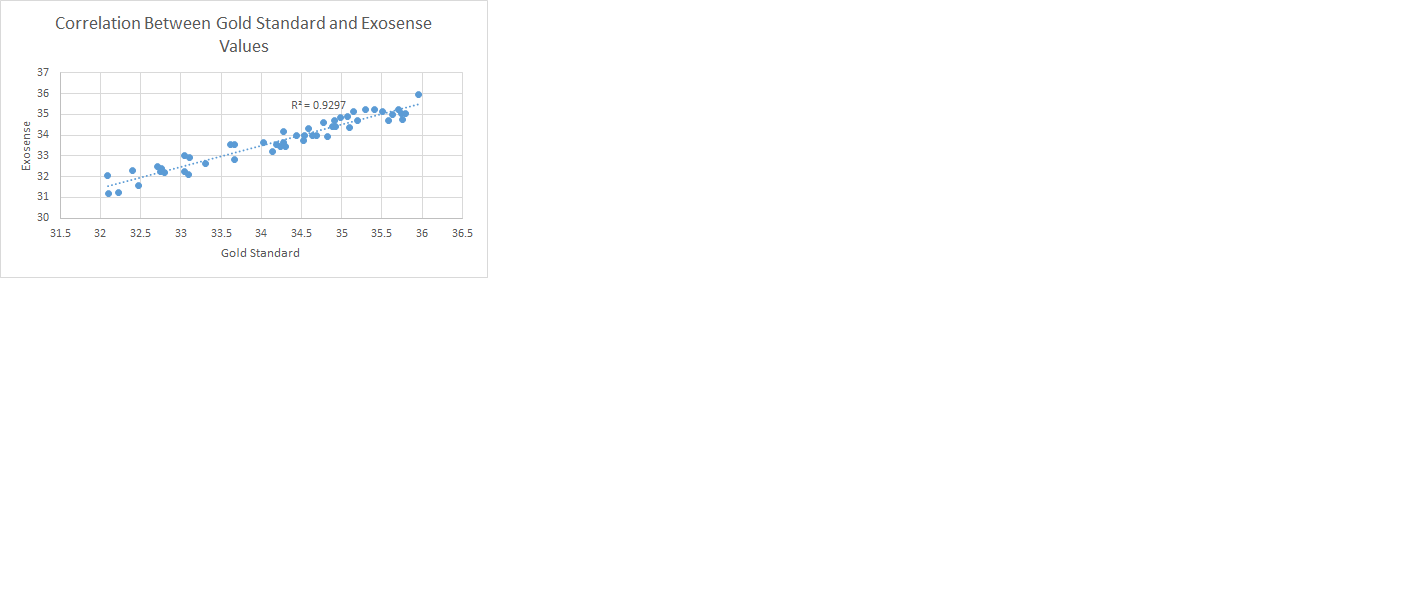
LAB 3B WRITE-UPTarget Population and NeedTarget Population The American Cancer Society reports that 3.5 million cases of basal and squamous cell skin cancer, and 73,000 cases of melanoma are diagnosed in this country each year. The Center for Disease Control reports the state of Arizona has one of the highest heat exhaustion rates in America. The Exo-Sense records UV radiation and external body temperature to help prevent skin cancer and heat exhaustion. The Exo-Sense is for any active person concerted about the sun and temperature outside. The minimalist design of the Exo-Sense makes it convenient to wear and its compatibility with Apple and Android makes it easy to read. http://www.cancer.org/cancer/skincancer-basalandsquamouscell/index http://www.mayoclinic.org/first-aid/first-aid-heat-exhaustion/basics/ART-20056651 Target Need Nobody gets sunburned or heat stroke on purpose. Our device is meant to provide people with easy to read data telling them if they are about to get sunburnt or heat exhaustion. In the sunny Arizona climate, people need to protect themselves from the harmful rays of the sun. The Exo-Sense provides a solution to these problems.
Device DesignThe Exo-Sense is a stylish hat with an array of thin sensors lining the brim and one on top of the hat. The sensors are capable of measuring body temperatures and UV rays. The temperature array is seamlessly integrated into the liner of the hat making it comfortable, just like a regular hat, on the head. The UV array will located on the very top of the cap, in the ball of the cap, keeping the classic structure of any hat while measuring UV rays. We will have UV sensors and head thermometers to measure UV index and external body temperature separately. All the data will be sent to your phone where our free app will display and notify you if your UV radiation levels or body temperature are approaching harmful levels. UV radiation will be measured in W/m^2/nm which is the same units used on the UV index scale. This measurement will combine with individual statistics on skin color, family history, and location to approximate how much time you have until you sunburn. Temperature will be measured in degrees Fahrenheit or Celsius and indicate external body temperature.
Inferential Statistics
Graph |
||||||||||||||||||||||||||||||||||||||||||||||||||||||||||||||||||||||||||||||||||||||||

