BME100 f2018:Group13 T1030 L6
| Home People Lab Write-Up 1 | Lab Write-Up 2 | Lab Write-Up 3 Lab Write-Up 4 | Lab Write-Up 5 | Lab Write-Up 6 Course Logistics For Instructors Photos Wiki Editing Help | ||||||
OUR COMPANY
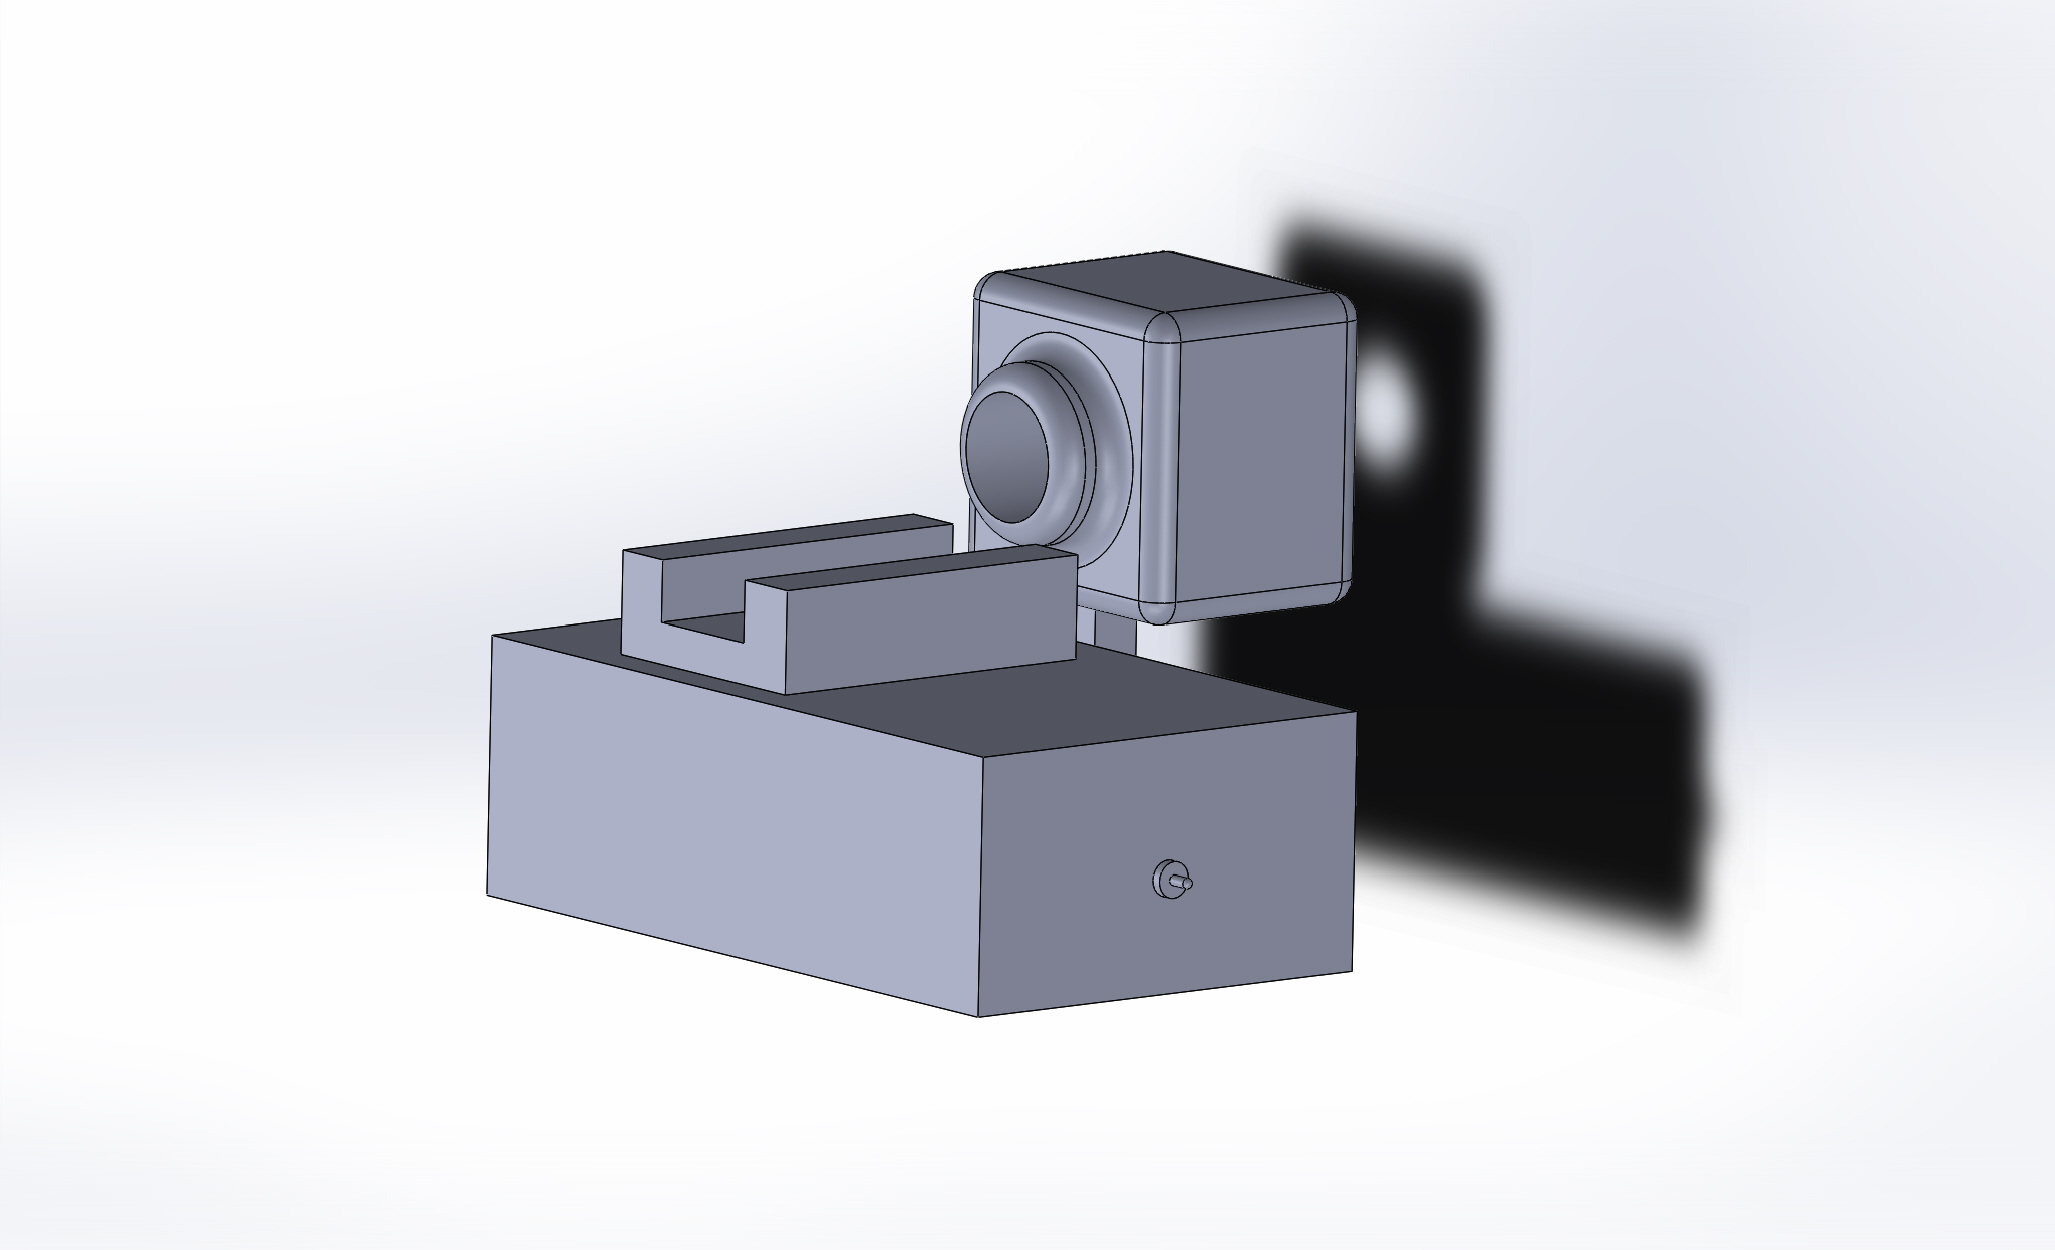
Our Brand Name LAB 6 WRITE-UPBayesian StatisticsOverview of the Original Diagnosis System In BME 100 Lab Section 10:30 A.M. there are 16 groups of about 5 students each. A total of 32 patients, with 2 patients per team, were tested for the disease-associated SNP. In order to prevent error, groups produced 3 replicates per patient, in addition to the positive and negative controls. Also, to prevent error for each replicate 3 pictures were taken for a total of 24 unique samples. By using ImageJ with these images, each group was able to compute a set of values that measured the amount of SYBR Green that is present. From there the values were complied into calibration curves to visually understand the data set. From these values, we averaged them to provide a quantitative value that could be used to compare to the positive and negative controls. For our first patient it proved that the positive control was the most similar and the negative control was closest to our second patient. Out of all 32 conclusions, 14 were positive, 17 were negative, and 1 was inconclusive. Some challenges that occurred during this lab were using the pipettes for the first time. This led to high error images and drops that had to be redone. Another problem we encountered was positioning the phone to perfectly capture the pictures in the same light and angle. However, even with theses issues our group was able to correctly identify the status of each patient for the SNP. What Bayes Statistics Imply about This Diagnostic Approach Calculations 1 and 2 were used to calculate the probability that the PCR results will return the correct diagnosis. Calculation 1 is the probability that the test result will come back positive and have the DNA sequence. The results for this calculation were high meaning that it was accurate in detecting the SNP. Calculation 2 is the probability that the smaple contains a non-cancer DNA sequence when the PCR gives a negative signal. For both calculations the results were close to 100% meaning that the tests were reliable in detecting and displaying the SNP. Calculation 3 was used to measure the probability of developing the disease given a final positive test. This calculation did not mean the patient would develop the disease later in life. A small result would mean that the certainty of developing the disease later in life from a final positive test is unclear. For our calculation 3, the result was close to a third. Calculation 4 is the probability of not getting the disease from a final negative test. Since the result of calculation 4 was close to one, it means the test is reliable in predicting that the patient will not develop the disease later in life. One source of error is switching between team members for pipetting. The inconsistencies would create inaccurate samples on the slide leading to incorrect sizes of the droplets for ImageJ. Another source of error is improperly positioning the phone. If the phone was not positioned correctly then when the pictures were taken it would not have captured the green light reflected by the SBYR Green. This would negatively influence the measures. A third source of error is taking the pictures with minimal light interference. This could have interference with the color of the DNA samples, which would mess up the ImageJ processing. Intro to Computer-Aided Design3D Modeling Our Design
Feature 1: ConsumablesFeature 2: Hardware - PCR Machine & Fluorimeter | ||||||
