BME100 f2018:Group1 T1030 L6
MILLENIA TECH
 |
 |
 |
 |
 |
LAB 6 WRITE-UP
Bayesian Statistics
Overview:
The goal of this investigation was to correctly identify disease-associated SNP using a Polymerase Chain Reaction (PCR) in a total of 6 DNA samples (3 per patient). Our lab period consists of 17 groups in which DNA samples from 32 patients were dispersed evenly for identification. Each group was assigned both a positive control DNA sample containing SNP and a negative control without it to prevent diagnostic error. Control samples were provided in addition for comparison purposes. The ImageJ analysis was calibrated using calf thymus DNA to demonstrate the linear relationship between the concentration of DNA and mean RAWINTDEN drop-background. Three images were taken of each DNA sample and further measured using ImageJ. The results indicated 14 patients tested positive for the disease while 17 patients tested negative and 1 was inconclusive.
What Bayesian Statistics Imply:
- For the first calculation, the probability of a positive result was 44% and the probability of a positive PCR reaction was 42%. The probability of a patient receiving a positive conclusion if they had a positive PCR reaction was 94%, meaning there was some error in the test results but it was still relatively accurate in diagnosis.
- In the second calculation, the probability of a negative conclusion was 53% and the probability of a negative PCR reaction was 51%. In the final step of this calculation it was determined that the probability of a negative solution given a negative PCR reaction was 98%, this means that the class was almost completely accurate at determining that a patient who gives a negative conclusion had a negative PCR reaction.
- For the third calculation the probability of a positive final test conclusion was 34% while the probability of the patient developing the disease was 44%. Given this information the probability a patient developing the disease given a positive final test conclusion was 33%. Meaning there is a low correlation between developing the disease and giving a positive final test result.
- In the fourth calculation, it was determined that there was a 66% of getting a negative final test conclusion and a 53% changes the patient will not develop the disease. The probability that a patient would test negative and not develop the disease was 96% this means the test was almost 100% accurate in determining this bayesian statistic.
What the Results Imply:
Sensitivity is the probability that a person with the disease will return a positive test this calculation was measured in calculations 1 and 3. In calculation 1 the probability of a positive conclusion along with a positive PCR reaction was determined to be 0.94. Sensitivity is also measured in calculation 3 where we were finding probability of the patient developing the disease given a negative conclusion this probability was 0.33. This calculation was rather low because it is unlikely that a patient develops the disease after testing negative. The probability of a person who does not have the disease testing negative is called specificity, which was measured in calculations 2 and 4. In calculation 2 we found probability of negative conclusion with negative PCR reaction and in calculation 4 probability of no diagnosis with negative conclusion was determined.
Some possible errors include:
- Pipetting techniques
- The picture set up process
- The ImageJ areas
Computer Aided Design
3D Model
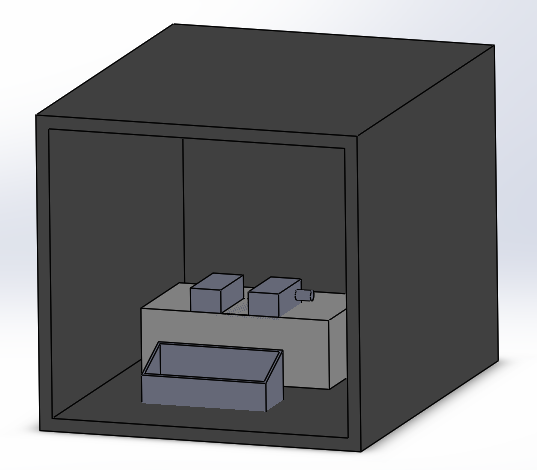
Our fluorimeter model was generated through SolidWorks due to the high quality and detailed images it provides. The whole group decided on which improvements to make, but Domenik was assigned the task to create the model. With prior experience using SolidWorks and simple shapes to build, it was not difficult to produce our fluorimeter system. The only challenge was figuring out how to use a new feature and assembling the parts. Overall, the model demonstrates our vision of the new fluorimeter system. This new design allows for more consistent pictures and eliminates any possible light from getting in.
Our Design
Feature 1: Consumables
The product will include a kit of consumables consisting of PCR tubes, glass slides for the fluorimeter, and the necessary reagents for PCR (SYBR Green, PCR mix, and buffer). These consumables would be specific for our design and would therefore be included with the product. Other products needed for the lab are an appropriate micropipette to deliver the desired amount of solutions and micropipette tips to fit it. The consumables that are included in our product are the same as in the original PCR process since they are relatively low cost and reliable. It was determined that there were more significant issues with the PCR product than with the consumables.
Feature 2: Hardware
The hardware for the original product includes the PCR machine, the fluorimeter, the phone cradle, and the light box. For our product, the PCR machine will remain the same as in the original process. The PCR machine produces reliable and accurate results and is fairly easy to use, therefore this part of the hardware did not need to be modified. The fluorimeter, phone cradle, and light box caused most of the issues with the process because it was very difficult to put the fluorimeter in the light box without disturbing the sample. That is why our new process includes a light box with velcro on the bottom of the box and the bottom of the fluorimeter and phone cradle. This will hold the the fluorimeter and phone cradle in place, but also allow for their removal if the placement needs to be adjusted or if the components need to be cleaned. The light box will also be modified to have one side of the box fold open so that the samples can easily be placed on the fluorimeter. The light box will also have a removable top so that it can be open for easy access to the inside or closed for maximum light blockage.
